What is a timetable?
A timetable can look simple: rows of trips, columns of stops and times. But for transit agencies, it’s the backbone of service planning. Timetables drive vehicle schedules, cost, and the GTFS feeds that power rider information.
When I first joined Remix, our timetable looked visually polished, but was slow, tedious, and error‑prone to use. It was a black box that planners didn’t really trust and hindering adoption of Remix by service planners.
From calendaring research, we heard the same themes repeatedly: editing trips was painful, bulk changes were nearly impossible, and a single mistake could ripple across an entire service change. For service planners, this wasn’t just an annoyance — it was a reason to stick with legacy tools and limit their use of Remix.
Timetable usability had become a strategic weakness: it blocked adoption among schedulers, limited what we could build on top (like advanced calendaring and runtimes), and made it harder to win and expand customers.
Strategy: a phased approach
The problem space was broad: from basic table interactions like bulk edit and undo to complex runtime models across geographies. My PM and I proposed a phased approach:
Phase 1: Sweat the fundamentals: Fix the basics so planners can edit timetables quickly and safely. Use this phase to deeply understand adoption blockers and real‑world workflows.
Phase 2: Set ourselves apart: Use those insights to design defensible features — like a runtime engine and timed connections — that competitors couldn’t easily copy.
This structure helped the team digest a complex problem, sequence the work sensibly, and keep us honest about when we were solving foundational issues versus “delight” on top.
Building the foundation
Design goals
First we aimed to fix the basics so planners can edit timetables quickly and safely. Use this phase to deeply understand adoption blockers and real‑world workflows. I framed it around two goals:
- Fast & Flexible: Planners should be able to perform common timetable edits with minimal training and responsive feedback.
- Reliable: Edits should feel reversible and understandable, so planners trust the tool with critical schedules..
Key changes
I started with a design doc cataloguing pain points, hypotheses, and design explorations. It became our shared source of truth and a record of decisions.
We then shipped a series of targeted improvements:
- Filters and bulk editing tools to speed up repetitive operations across many trips.
- Clearer day creation and trip manipulation flows so planners could express real‑world service patterns with clarity.
- Undo and redo Using concrete failure stories from customers (accidentally deleting many trips; struggling to remove wrongly added trips after resorting), I advocated to bundle undo into the bulk‑edit work. This made it easier to justify as risk mitigation instead of a “nice to have.” Undo didn’t come with flashy UI, but it was a significant step change in UX maturity — and quickly became one of the most appreciated improvements for power users.
Runtime engine
With a solid foundation in place, we could finally tackle deeper, more strategic problems. One of the loudest signals from research was runtimes.
Runtime is the time it takes a vehicle to complete a route. It drives vehicle counts, cost, and on‑time performance. Yet Remix was calculating runtimes using a flat speed across the whole city — a crude shortcut that planners didn’t trust.
In timetable research, we kept hearing:
- Runtimes in Remix felt like a black box
- Errors were hard to detect, often causing issues later on in operations
- Different regions had very different runtime practices
Our design goal: make runtime editing transparent and runtime generation more reliable, without overwhelming planners.
Start small to unblock the team
I kicked off the project with a team of engineers who had mostly worked on data infrastructure. They were hesitant to ship anything until they fully understood the entire runtime system end‑to‑end.
To unlock progress, I proposed a small, low‑risk first step: simply surface runtimes directly in the timetable UI. This gave us something useful to ship and a concrete artifact to test with planners.
Research: one problem, multiple mental models
With the prototype in hand, we reviewed real runtime data from agencies in different continents and interviewed service planners who lived in the timetable every day.
We quickly learned that, while planners in DACH regions rely on strict runtime profiles — detailed stop‑to‑stop patterns that the whole network follows, planners in North America and Australia think more in terms of peaks, off‑peaks, and hourly ranges.
This tension forced a key design question: how do we support a global user base without over‑optimizing for one region?
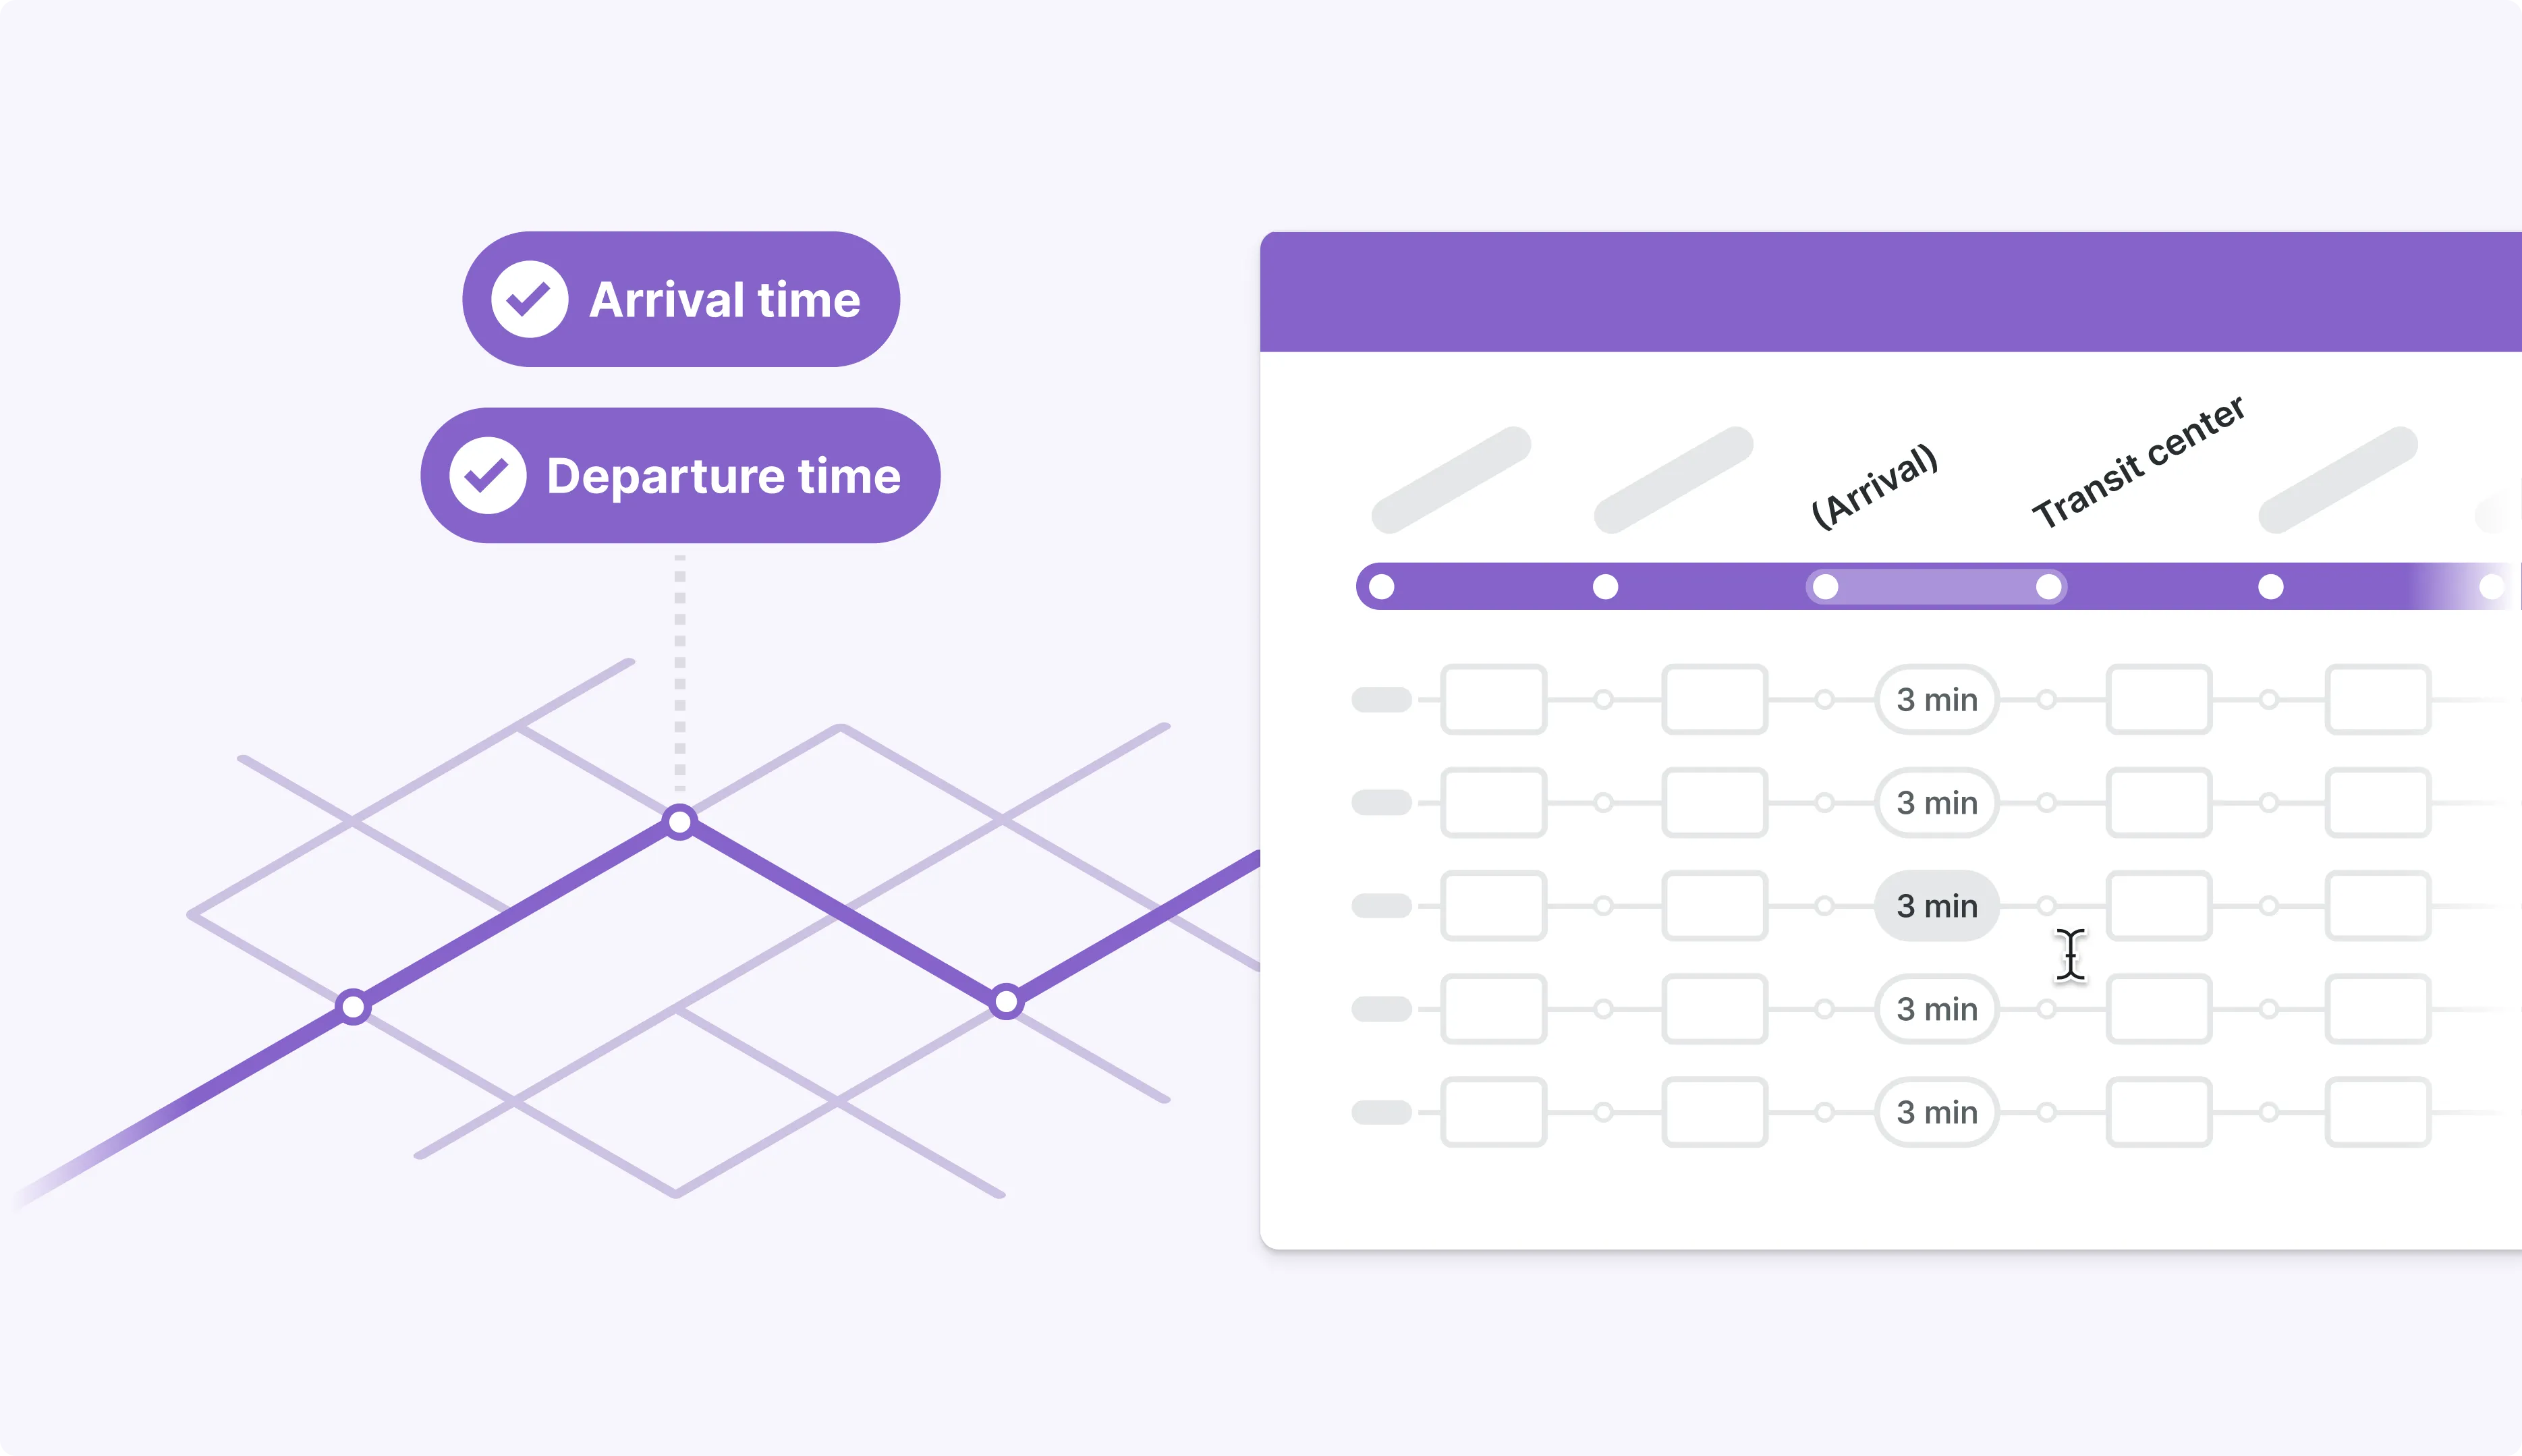
The prototype also helped us build conviction on the value of a runtime view as a new way of displaying trip data to help planners quickly understand the travel time patterns of trips.
Solution: line‑level profiles and multiple data sources
After multiple rounds of diagramming and stress‑testing with real data, we landed on a transit line level runtime profiles instead of network‑wide ones: simple enough to reason about for North America and ANZ planners, but precise enough for DACH planners with more advanced runtime management systems.
We also introduced two runtime sources to support existing and new routes:
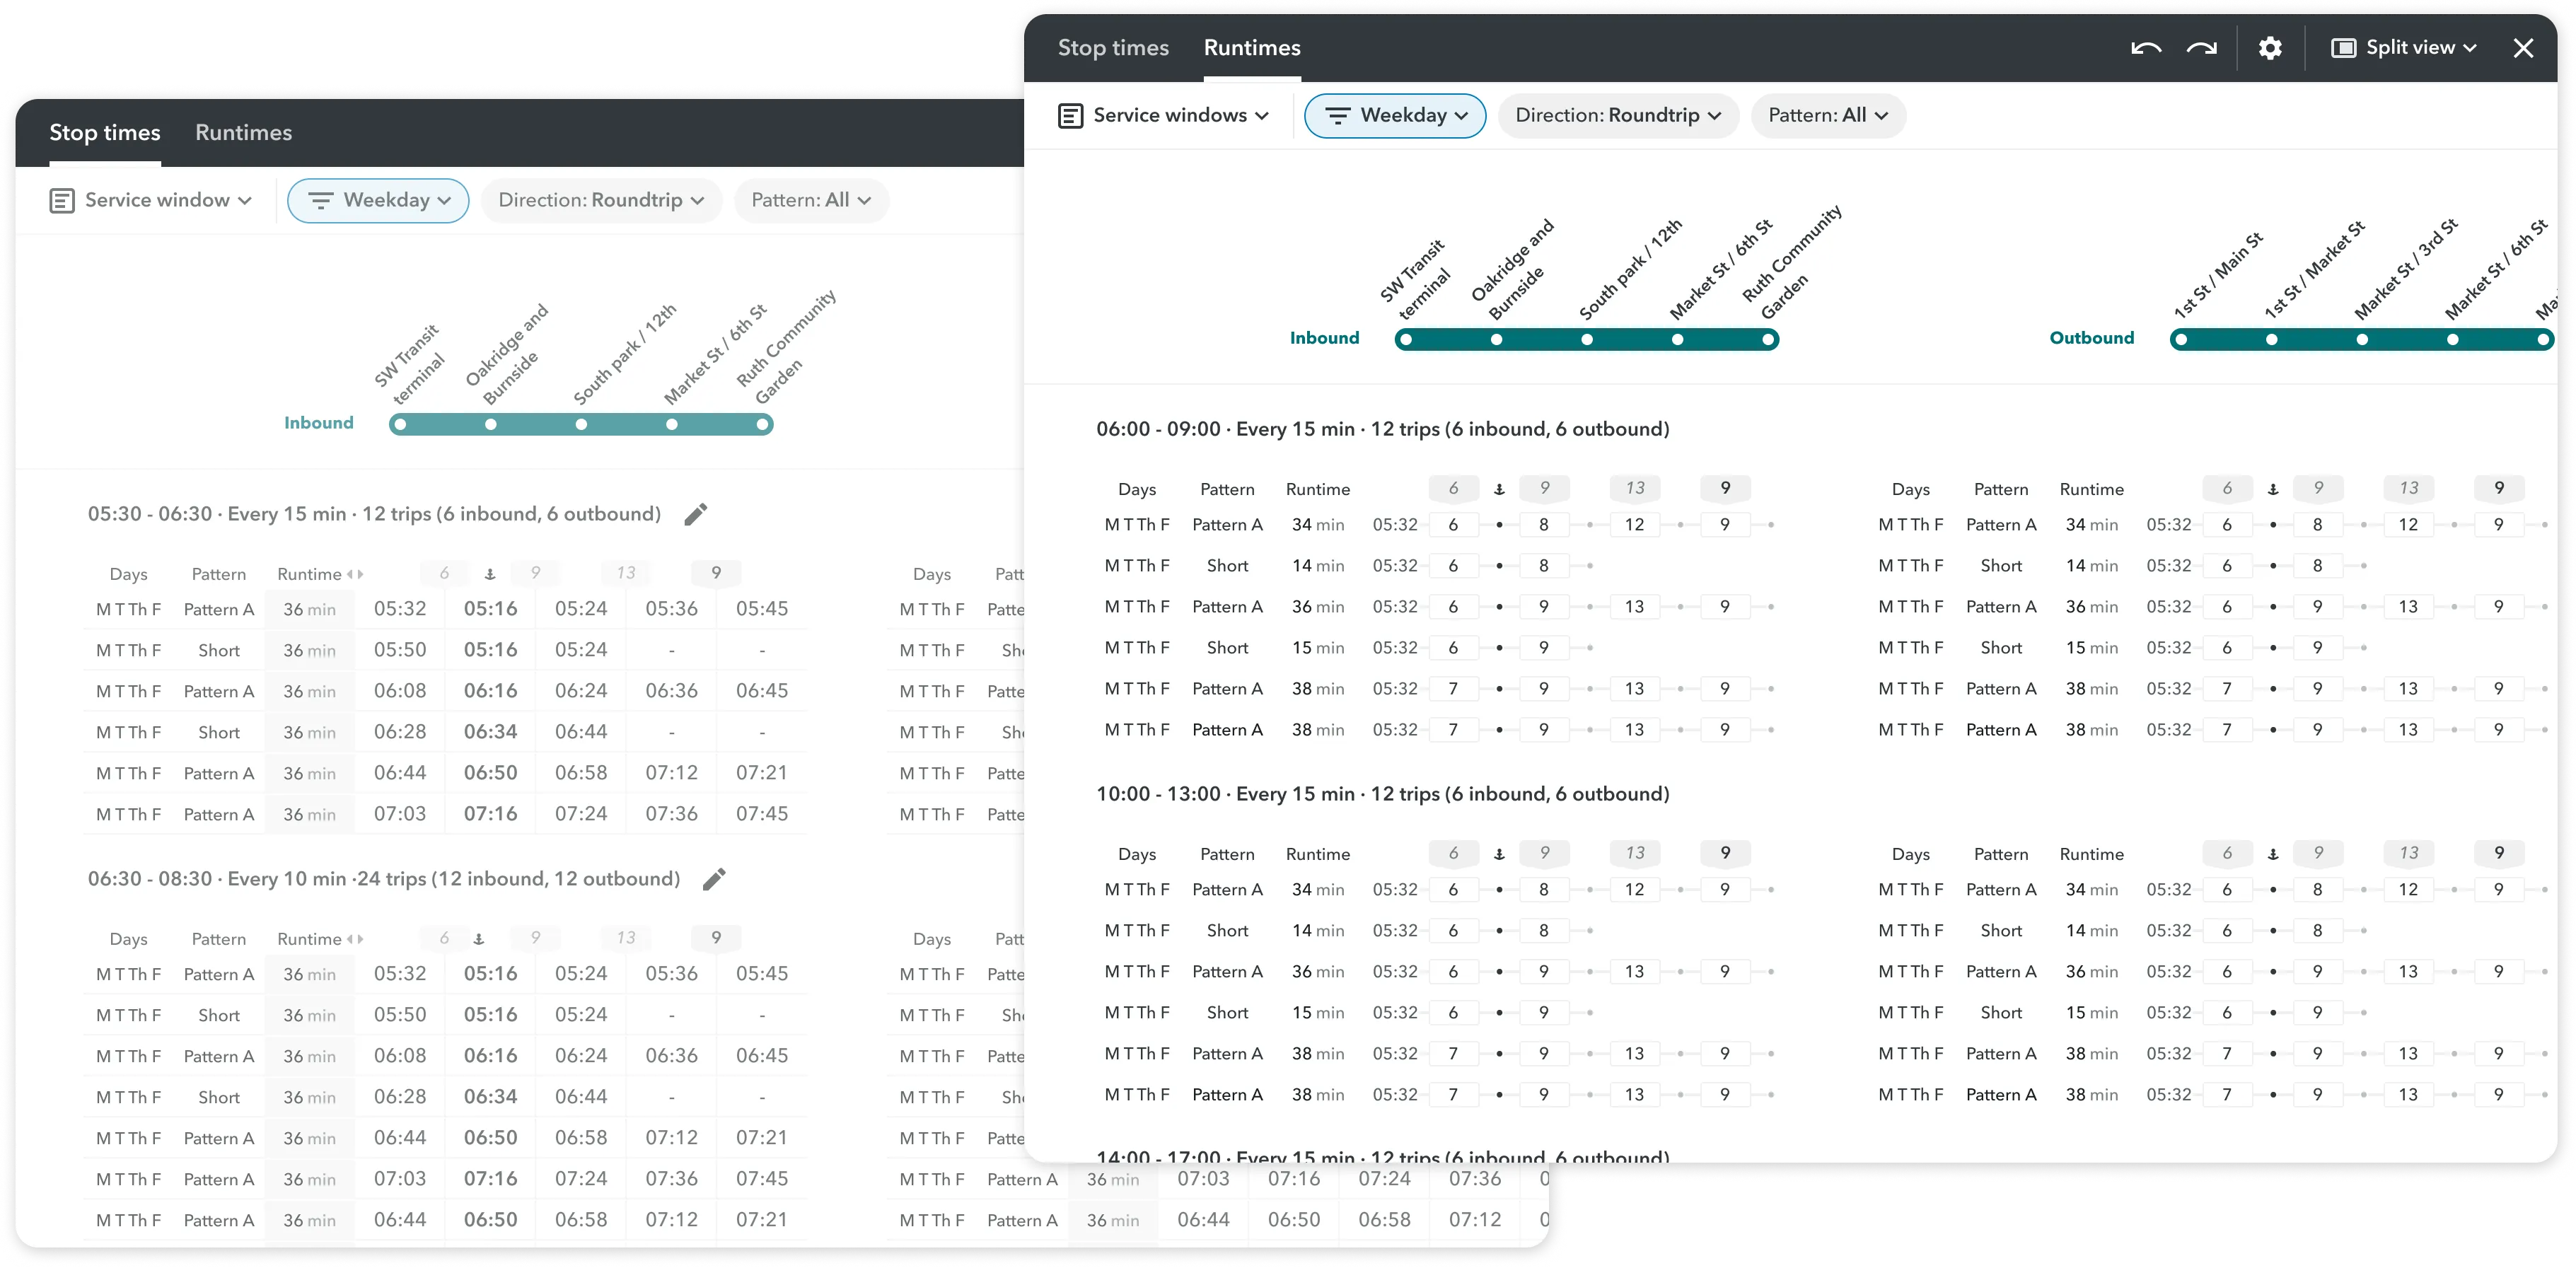
- Runtime profiles: The runtime view and the ability to “group by runtime” allow planners to quickly understand the travel time patterns of trips and make changes to them in their preferred mental model.
- Corridor runtimes: use historical speeds from roads where vehicles have already run, generated from the GTFS of the agency - data we already have.
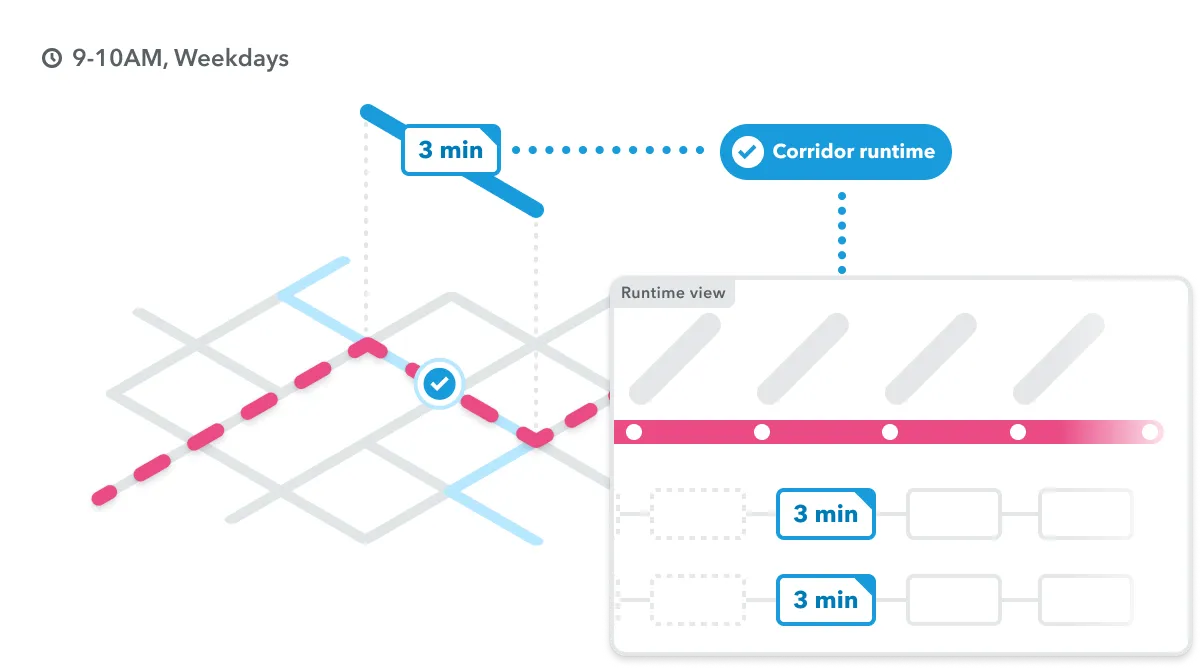
- Predictive runtimes: estimate runtimes on roads that have never seen service, generated from a predictive model trained on historical GTFS-RT data (real-time vehicle position data) so it’s rather accurate and updated.
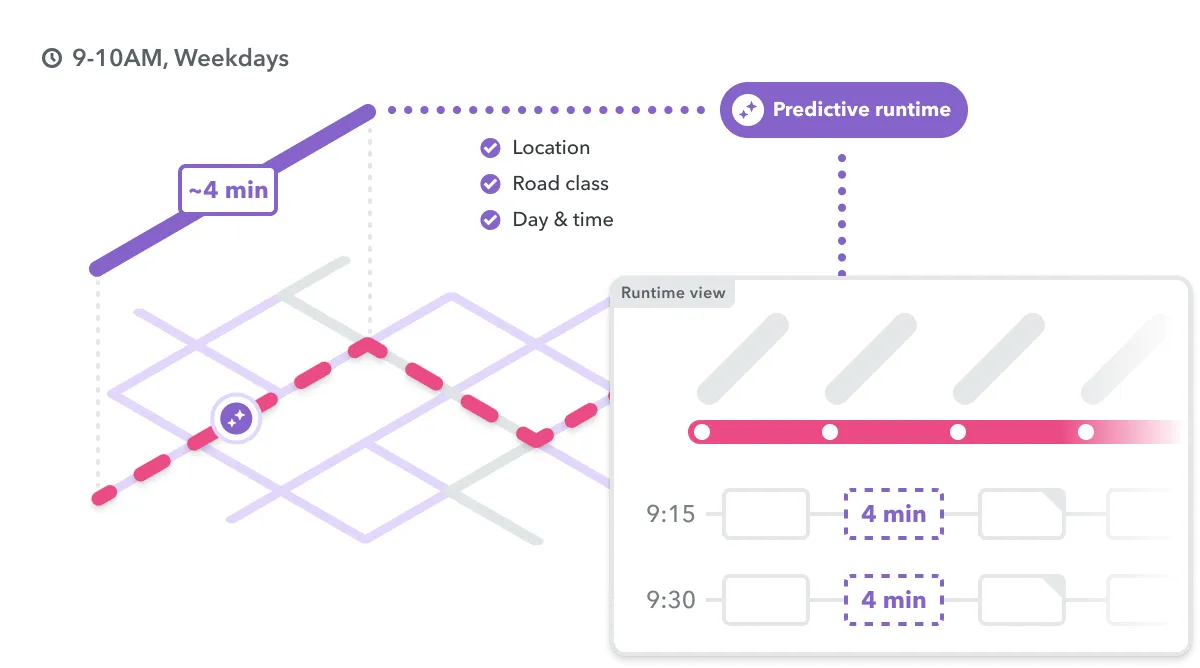
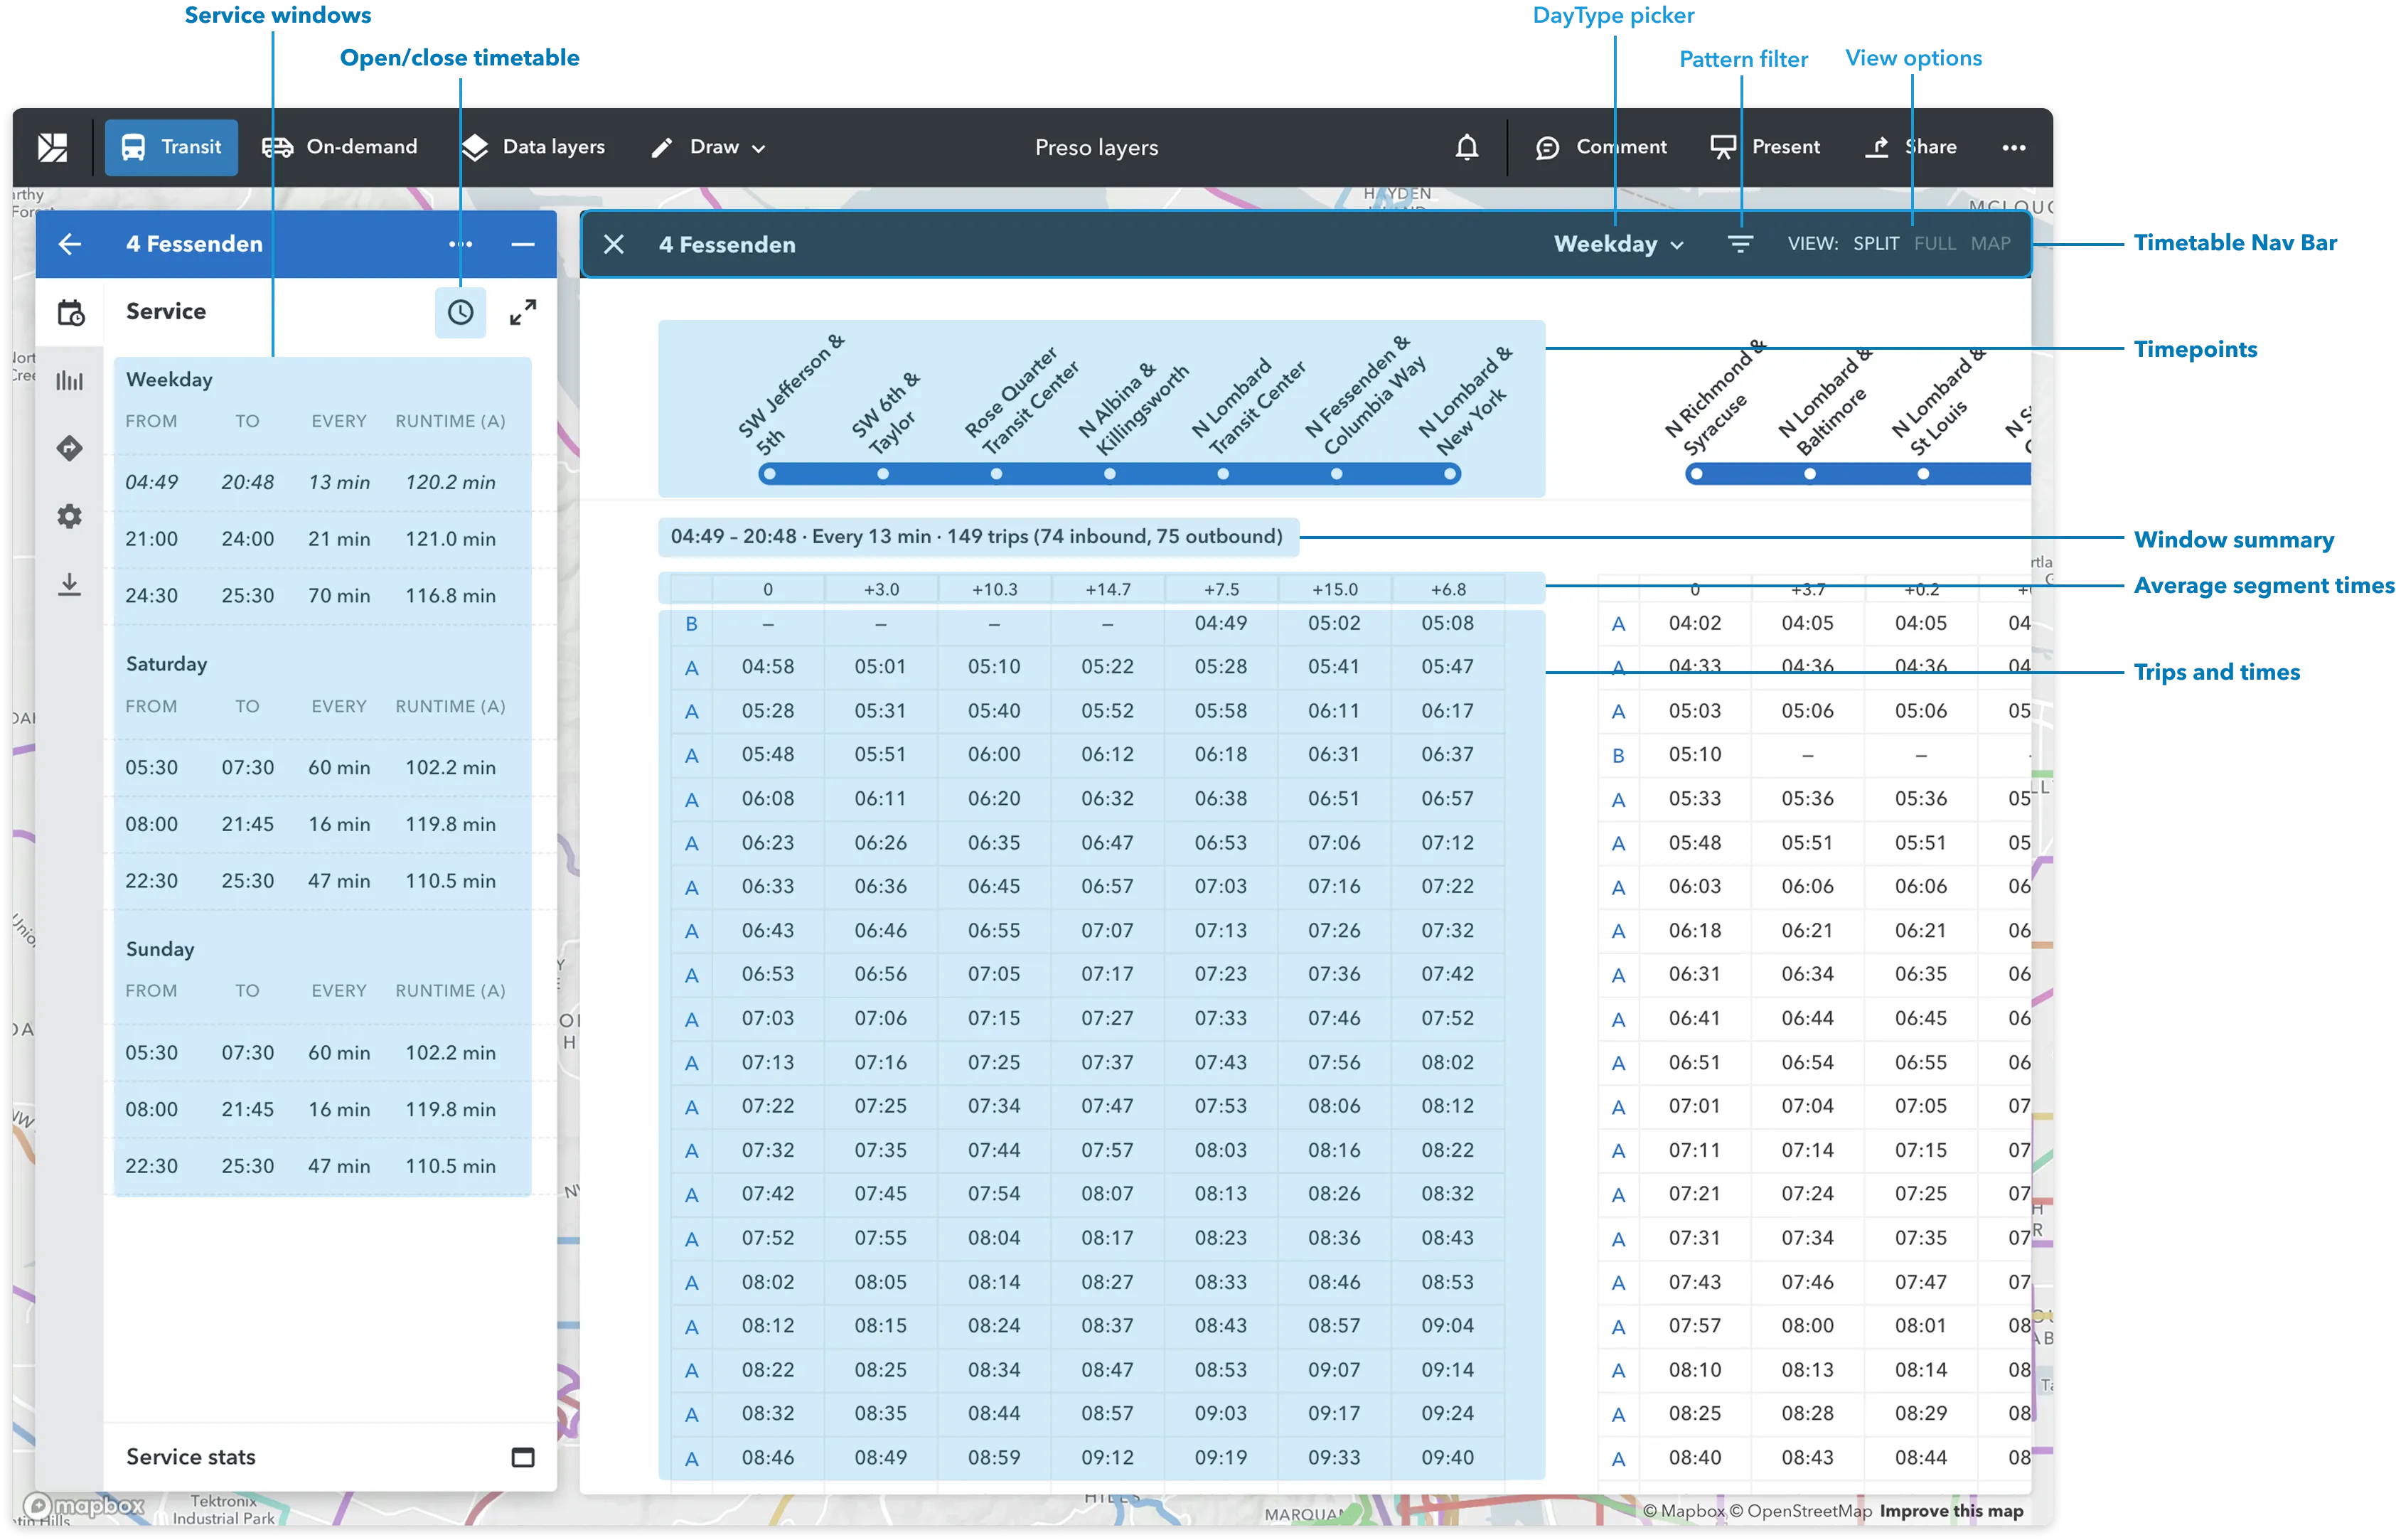
In the UI, I kept the visual language intentionally subtle to keep focus on stop times:
Corridor Runtimes: populate runtimes data for routes using roads your system has used before Predictive Runtimes: Predict runtimes on roads where buses have never run before. Together, these changes turned runtimes from a hidden system into something planners could see, adjust, and trust — saving them hours of manual work and making schedules more realistic.
Impact
For planners:
- Faster everyday workflows through filters, bulk editing, and clearer day creation tools.
- A safer environment for making changes, with undo/redo and better visibility into the impact of edits.
- More trustworthy runtimes and GTFS output, grounded in real data and clear visual cues.
For the business:
- Removed a key adoption blocker for service planners and schedulers, strengthening Remix’s position as a full service planning platform.
- Created important foundations for future features as we enter the space of operation data analysis.
Coming soon: Dwell time and connections Making the timetable more sophisticated to better reflect real world conditions and produce more accurate costing.