Overall approach
When we explore a new product line, we often don’t yet have the “perfect” users to interview or the ideal data to analyze.
- Rapid discovery - Learn and devour relevant information in the field, even if we can’t find the perfect people to interview - secondary research, adjacent roles, anything to establish a quick baseline understanding
- Cross functional collaboration and psychological safety - especially important as the early phase is exciting but also stressful. Truly listen to others, and feel comfortable raising your disagreement.
- Balance iteraction and conviction - Don’t feel too attached to any early ideas, but also take every chance to build conviction.
Disruption management (2024)
Context
In early 2024, I joined a special task force to tackle a universal pain point for transit agencies: keeping riders informed about service disruptions.
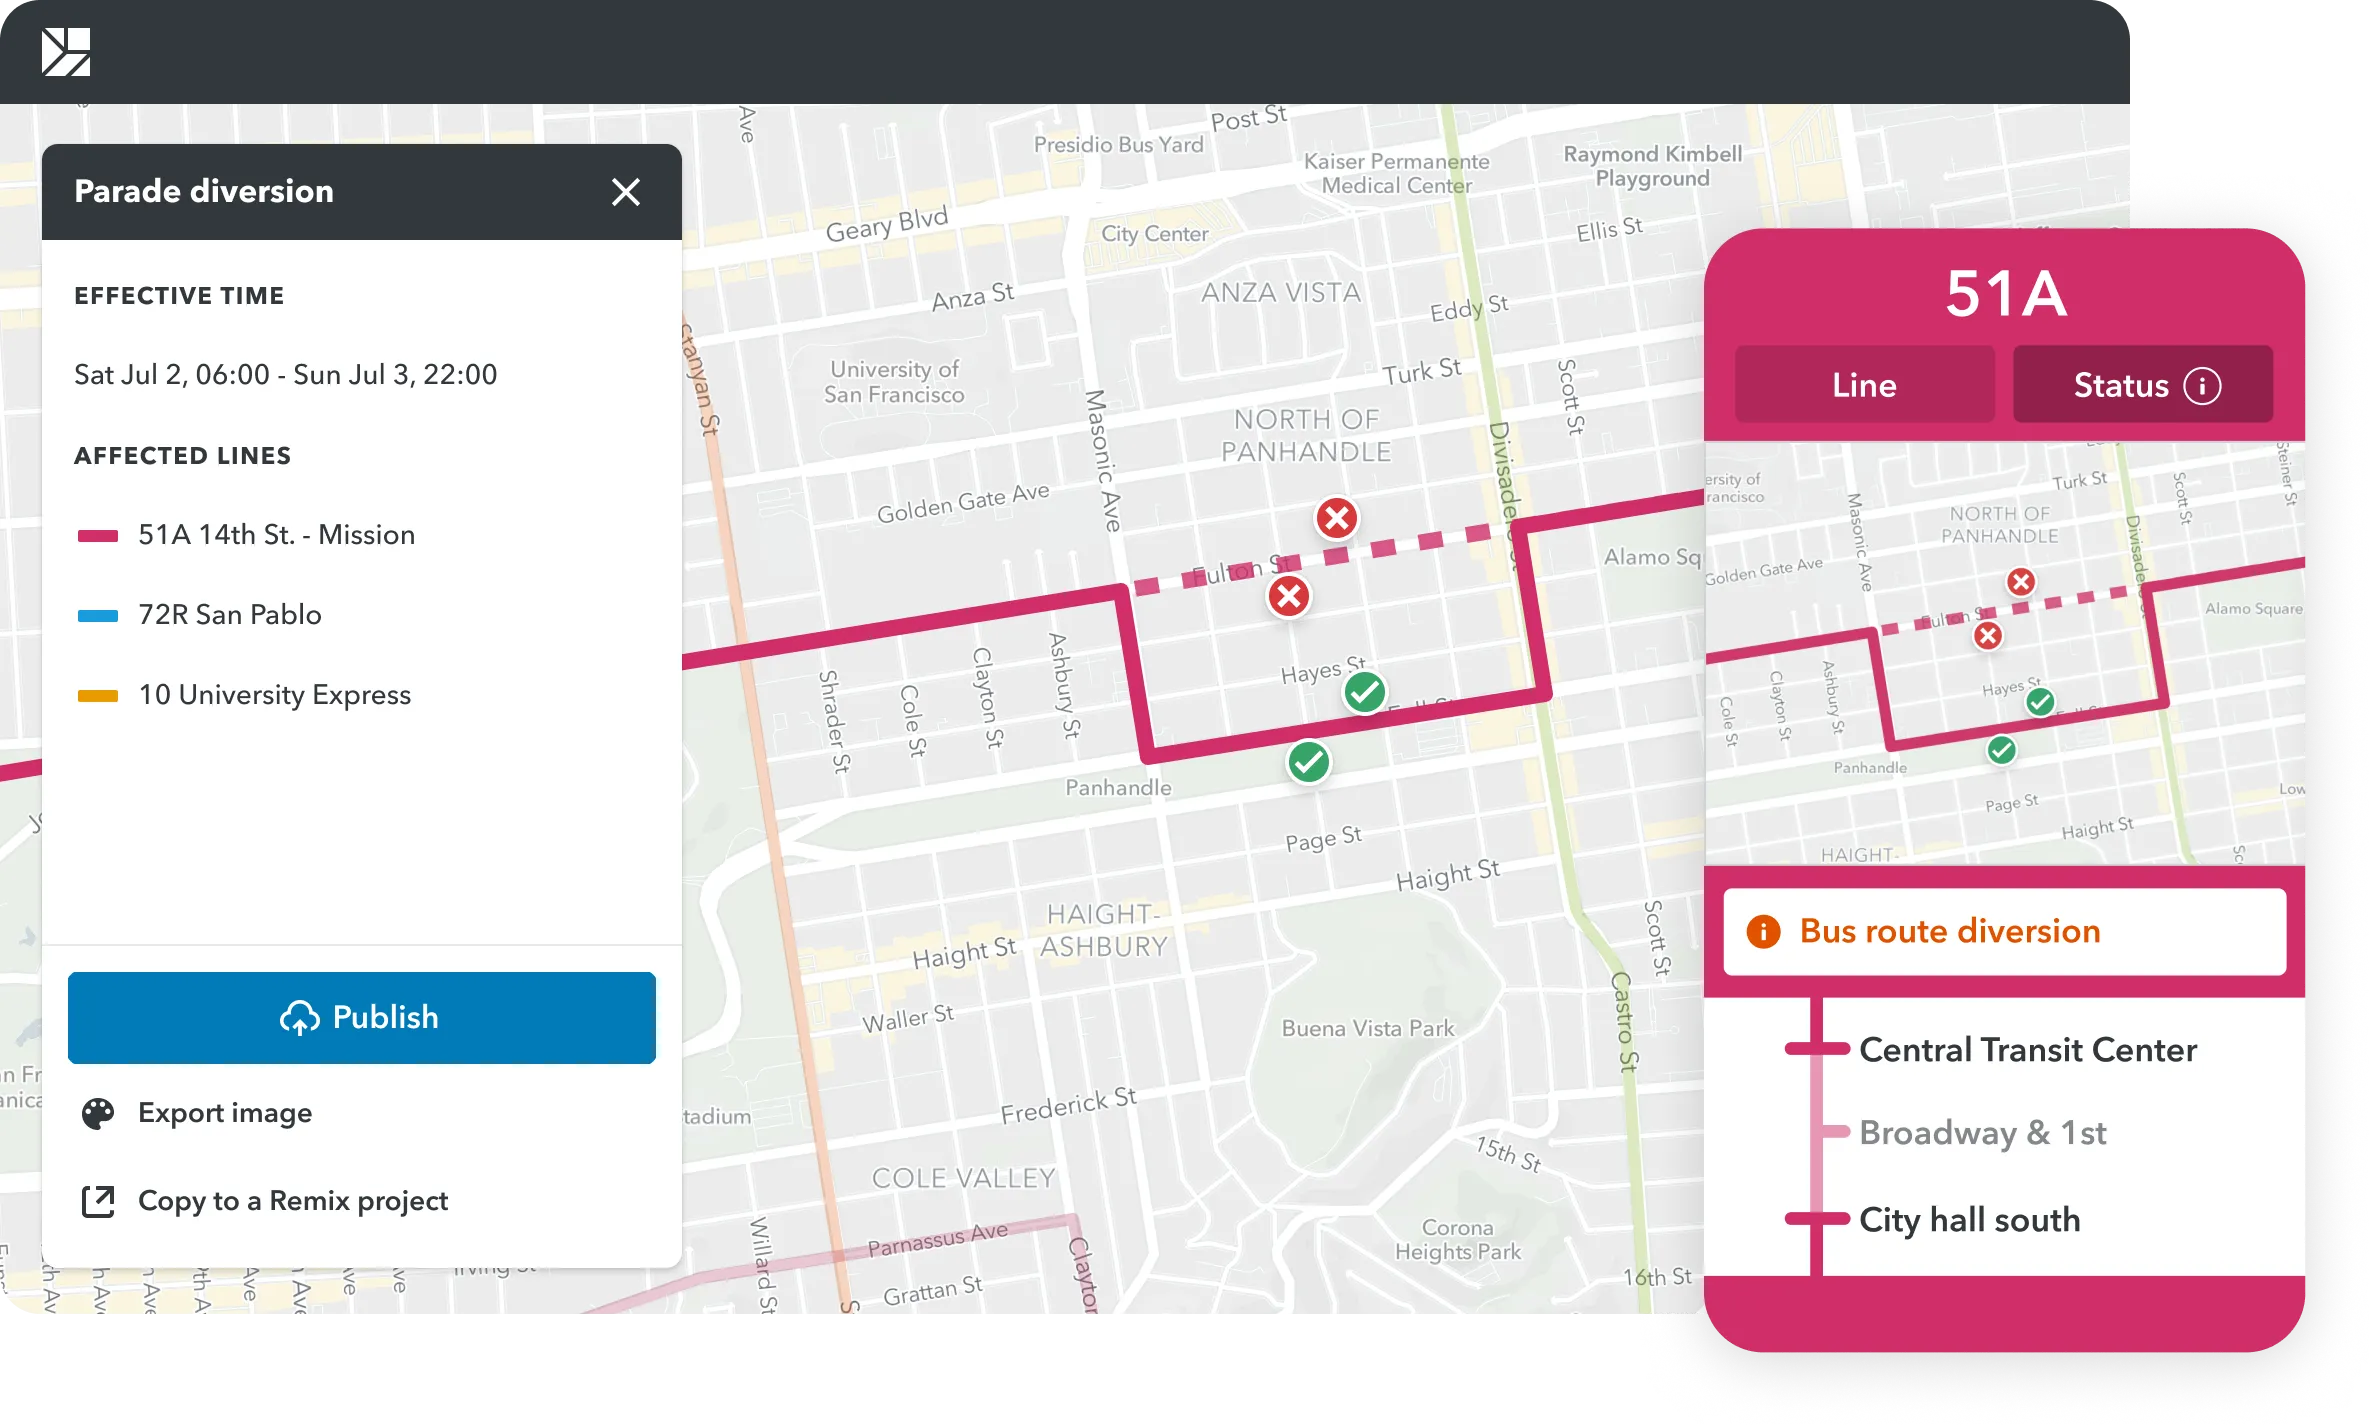
Via had just acquired Citymapper, a consumer trip‑planning app. A new “Citymapper for Cities” team was exploring a product line for agencies, and disruption management emerged as a piece of the puzzle that was best suited to live inside Remix — a tool planners already trusted to make maps and communicate detours.
Visuals alone weren’t enough. To actually reach riders on Citymapper, Google Maps, and other channels, disruption information needed to become structured data that downstream systems could consume.
The core problem statement we rallied around was: Transit agencies want to prioritize disruption communication because it directly affects rider satisfaction and ridership. We need better tools and workflows for agencies to quickly and widely inform riders about upcoming disruptions.
Discovery
Through early research, we learned that “disruptions” sit in different parts of the org depending on the agency — marketing, operations, service planning — and that each brings their own tools and constraints. We decided to focus first on planned disruptions, which were closer to our existing user base and required less integration with live dispatch systems.
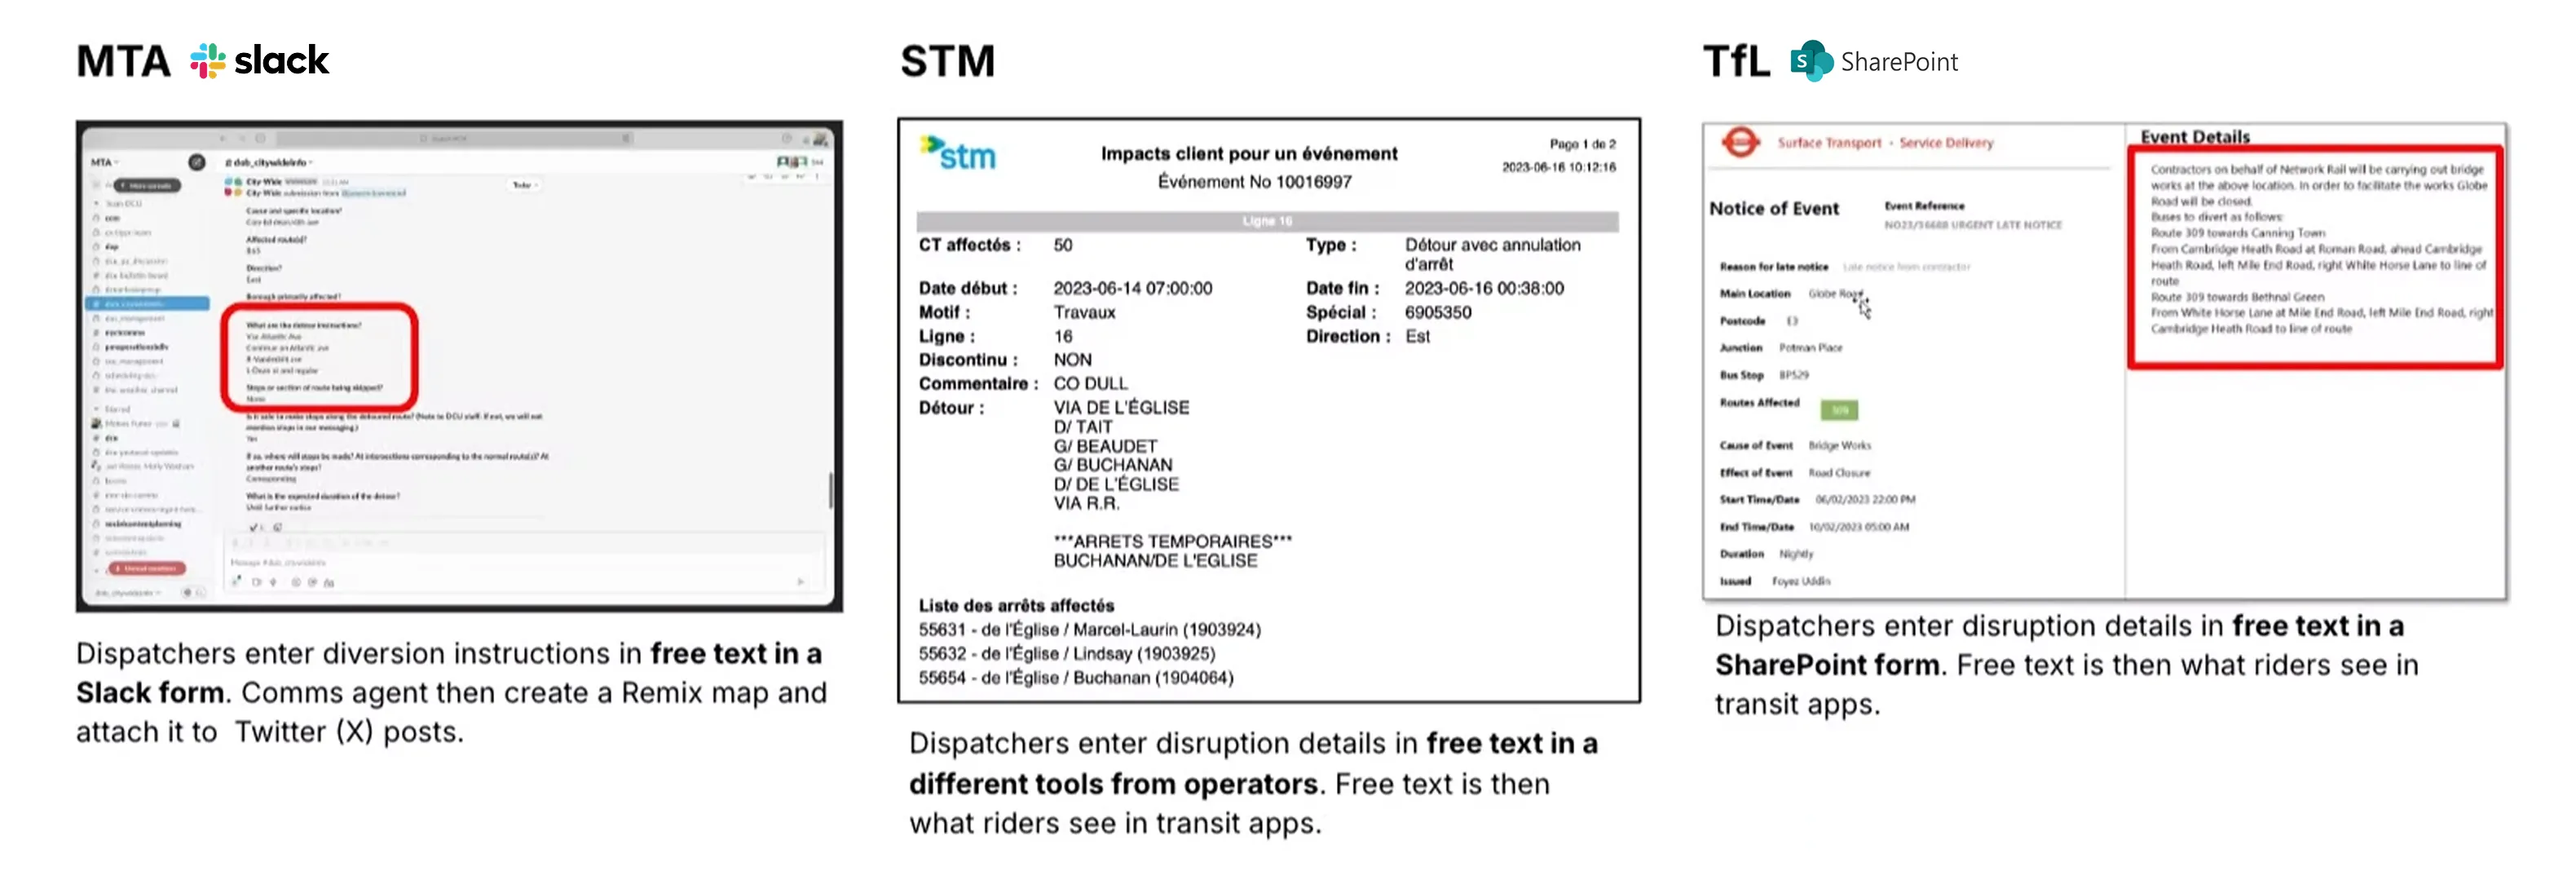
We found that existing workflows:
- were operations‑centric, packed with details critical for drivers and dispatchers but often irrelevant for riders,
- produced notices that were hard to integrate with rider‑facing systems, and
- were so time‑consuming that many disruptions simply never got communicated on time or at all.
Competitive research showed that most tools leaned on long forms and poor drawing tools. It was hard to produce a clean detour map quickly.
From this, we articulated early principles:
- Lean into the visual nature of Remix. Make drawing and editing detours feel obvious and fast.
- Design for humans, not data specs. Match human mental models for detour and stop closure, then generate GTFS‑compatible output behind the scenes (similar to my approach with GTFS Publisher).
Prototyping and learning
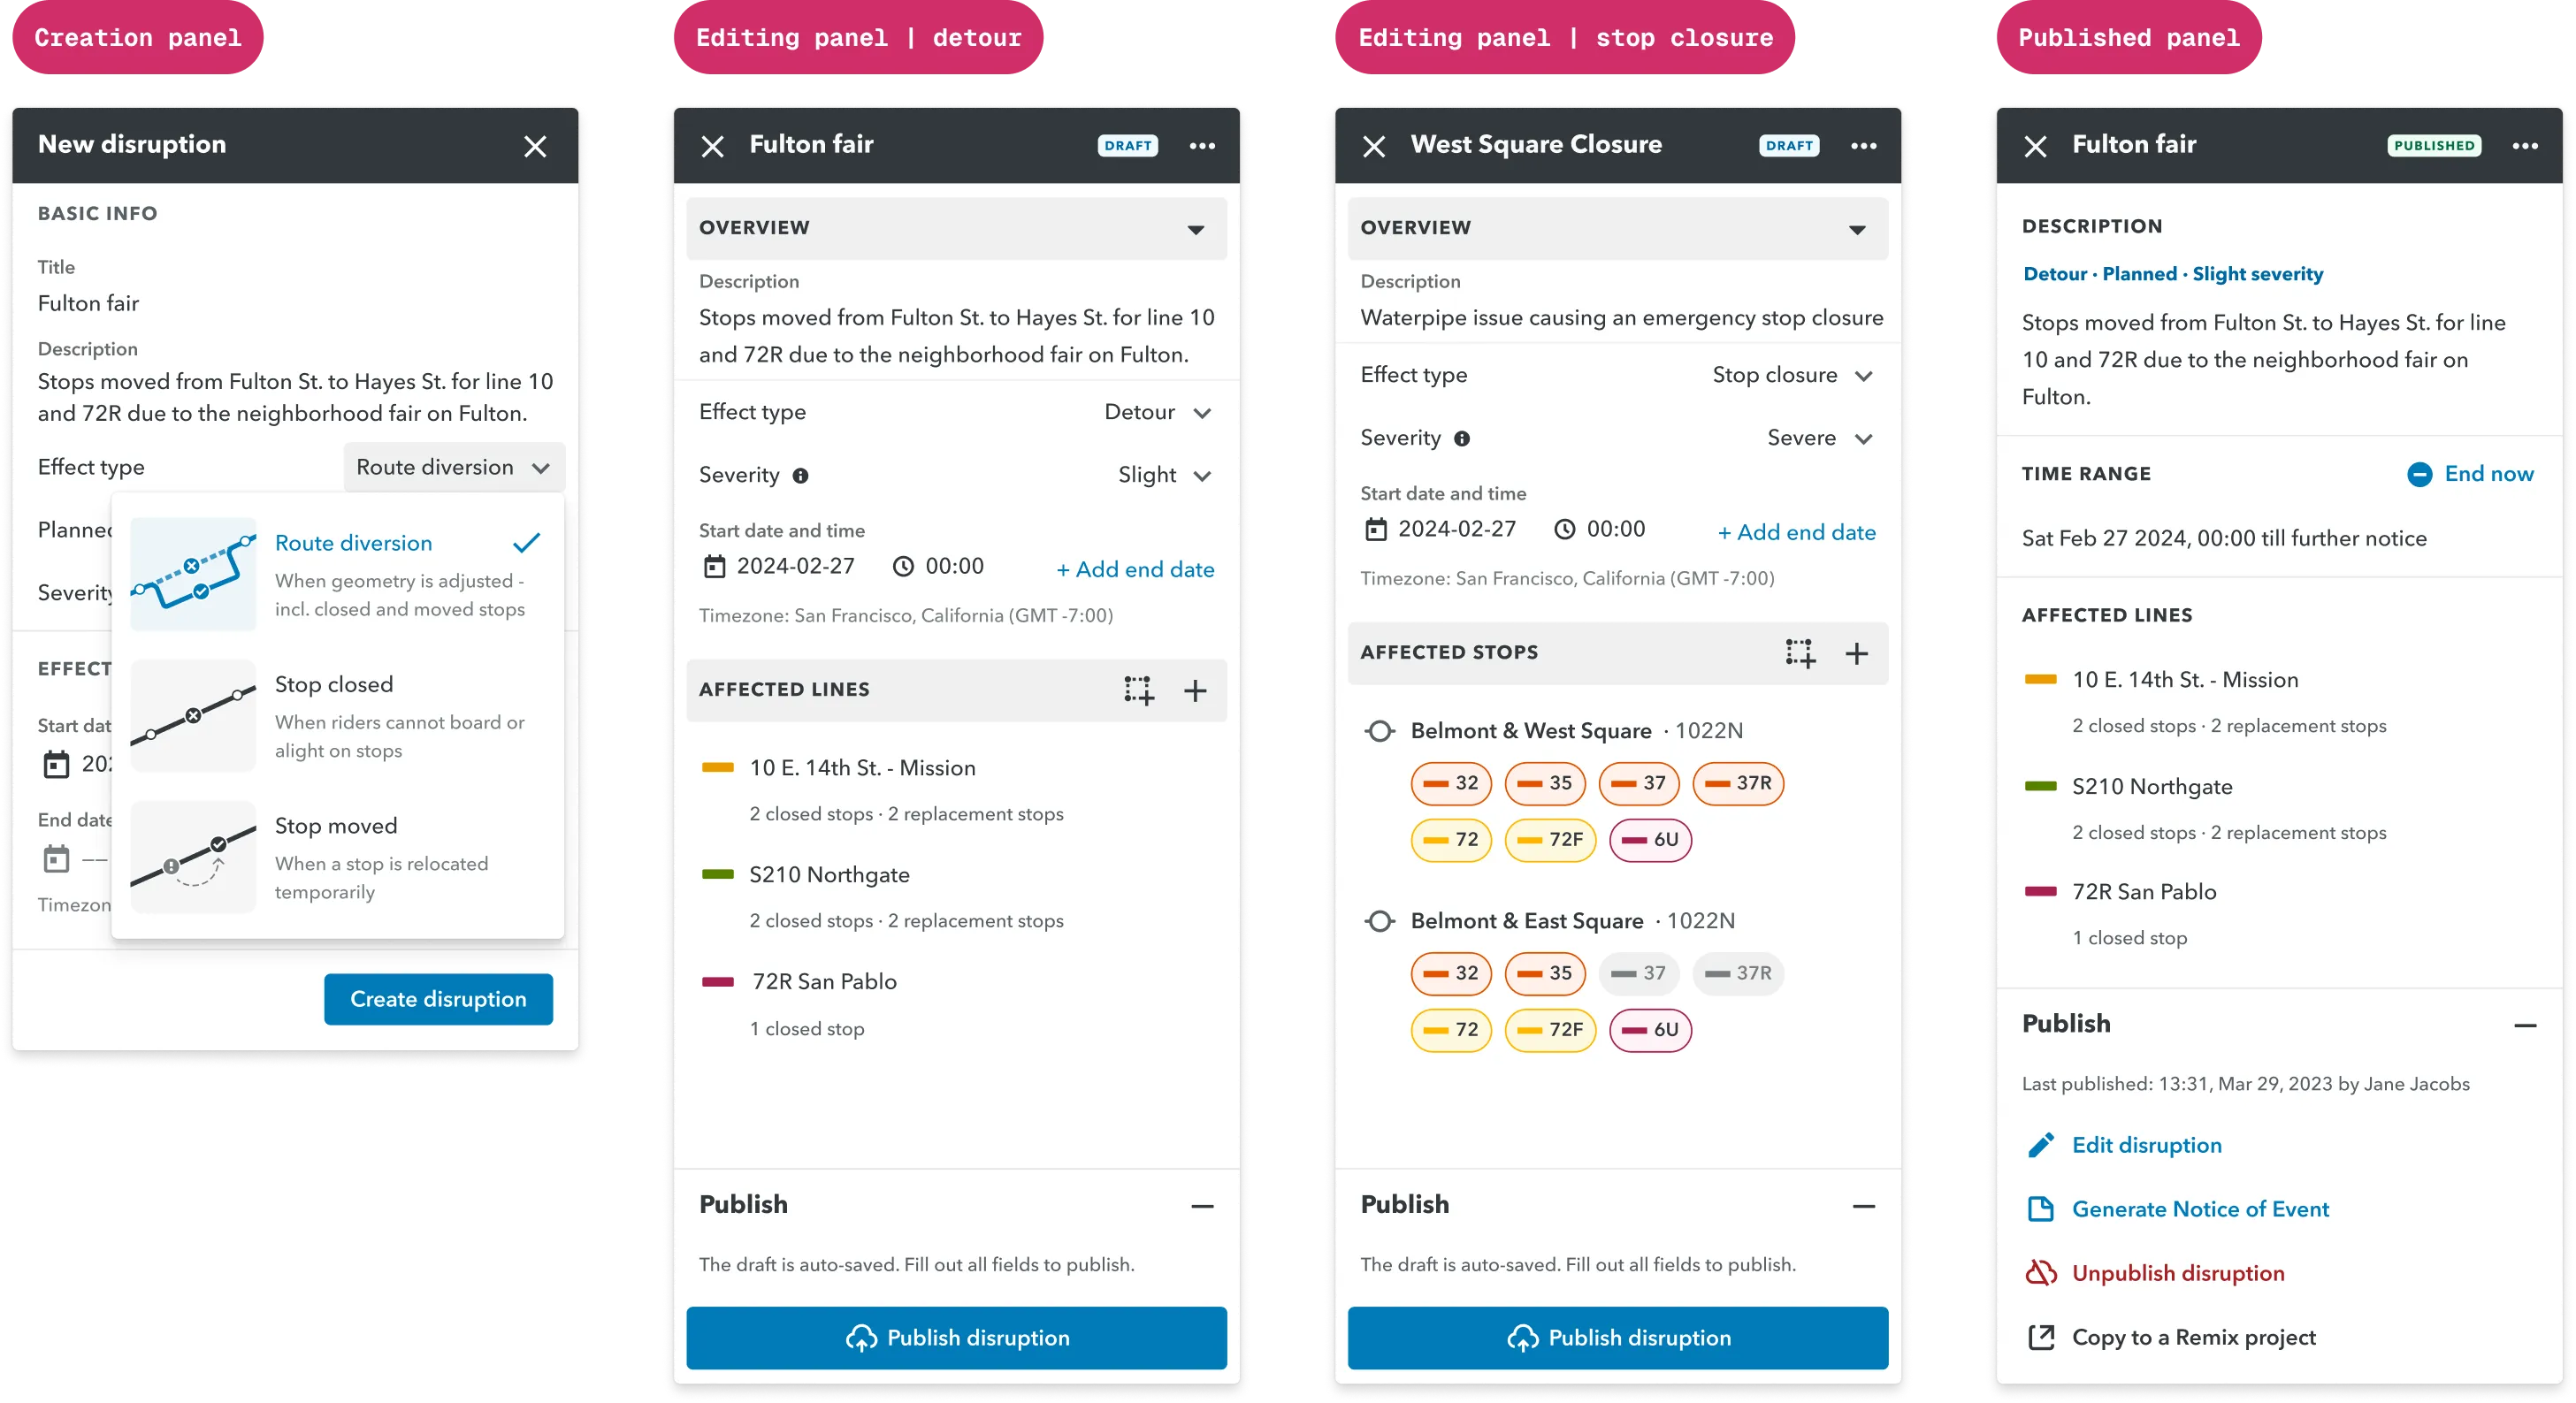
We moved quickly to scope an MVP focused on the two most frequent disruptions: stop closures and detours, so we could test with real data and real agencies.
- Structure and navigation We explored how much this should feel like a separate space versus an embedded feature, and how that impacted packaging and the learning curve. The goal was to balance future‑proofing with speed, avoiding growth patterns that would confuse high‑stakes operational work.
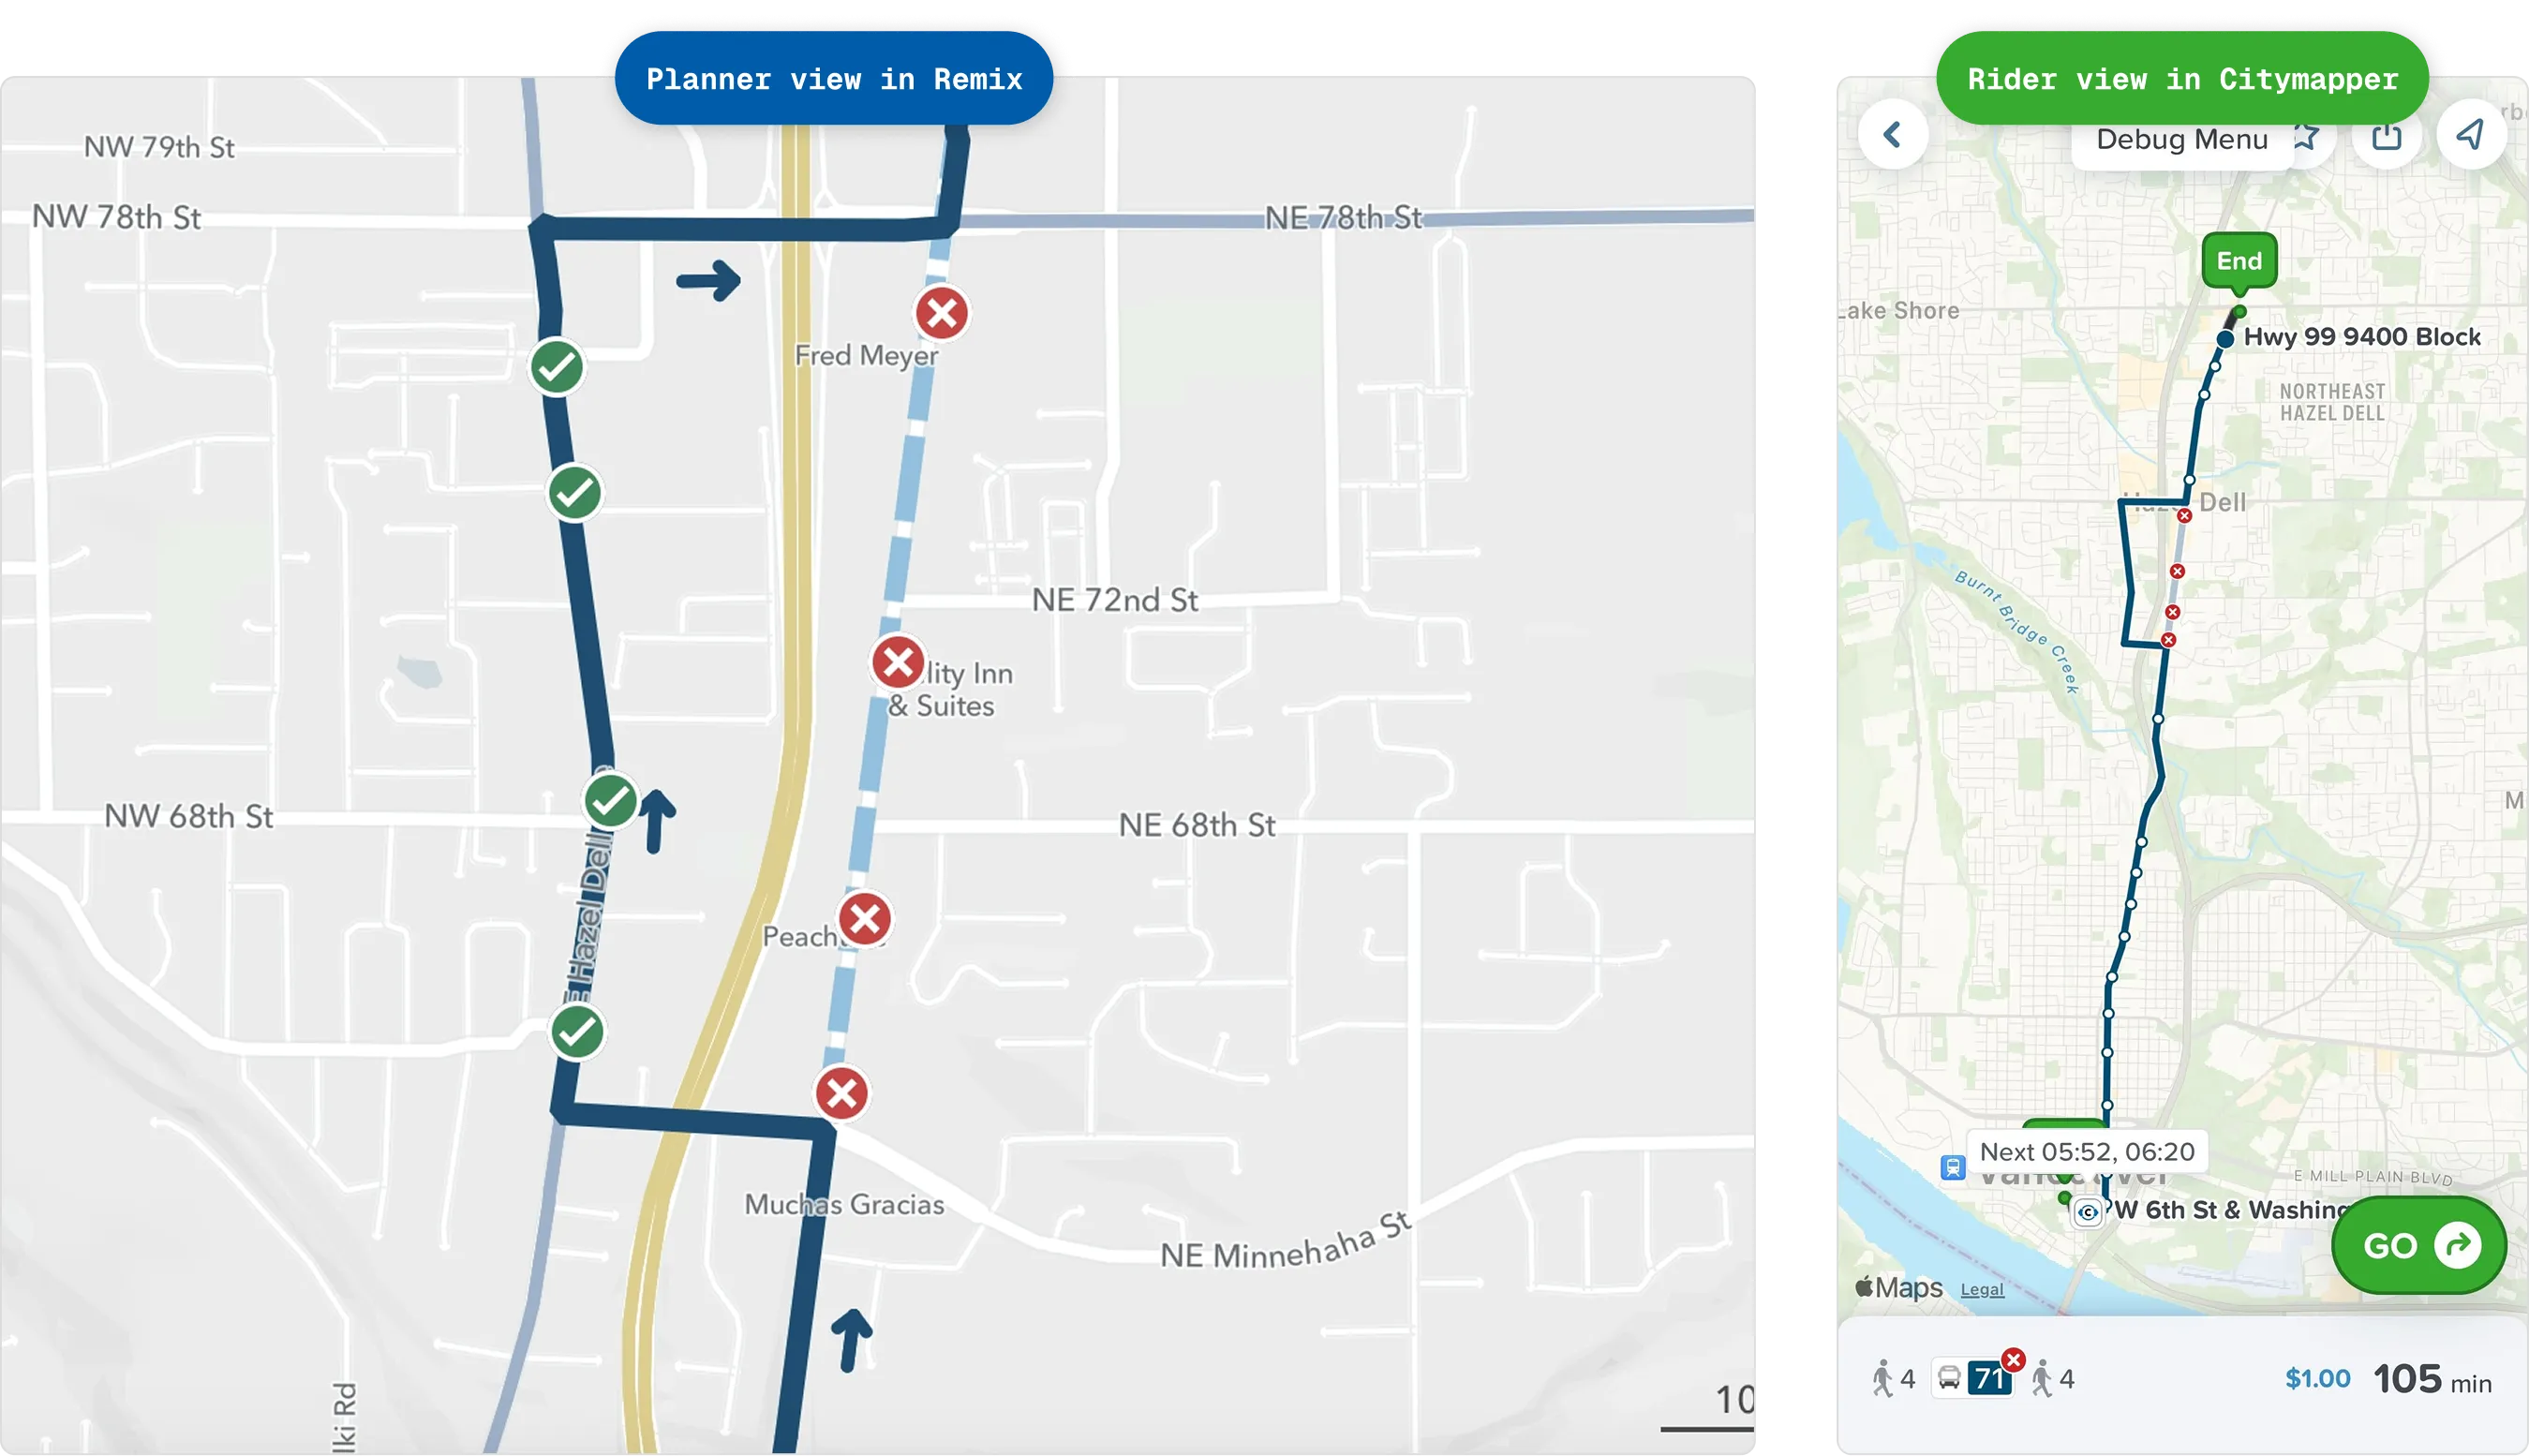
- “Splicing” detours Detours are one of the most time‑consuming disruptions to create. I worked closely with engineering on a “splicing” interaction that makes it simple and intuitive to draw a diversion. The tool snaps to the street grid, works across all variants of a route, and prevents common errors — a clear differentiator in competitive evaluations.
- Publishing and state management Because these disruptions feed rider‑facing apps, we needed to make state unambiguous. We learned that users often begin a disruption without knowing the exact end date, so we designed disruptions to be editable at any time, even after publishing, while still preserving traceability.
For riders, one of the biggest pain points is receiving a wall of text about a disruption without seeing where the detour actually goes or whether it affects their journey. Detours created in Remix can be published directly to Citymapper, so riders looking up directions see accurate, map‑based changes. One of our early pilots with C‑Tran in Washington State gave us strong early validation of this end‑to‑end experience.
Signals and positioning
We’ve seen strong early interest from agencies like MTA (New York) and TfL (London), two of the most complex transit systems in the world. With MTA, we’re running a series of design workshops to deeply integrate the tool into their workflows.
At the same time, market feedback confirmed an important strategic decision: disruptions shouldn’t be tightly coupled to Citymapper as a product. It’s a standalone workflow that does not inherently depend on any single rider‑facing app. From a data and workflow perspective, disruptions sit very close to Remix’s existing GTFS publishing capabilities — essentially a real‑time extension of the same critical service data.
Key learnings
- Stay closely aligned with commercial teams from day one
- Test with real operational data as early as possible
- Treat this as a service design problem (tool + process + org adoption), not just a UI
Ridership modeling (2024)
Discovery
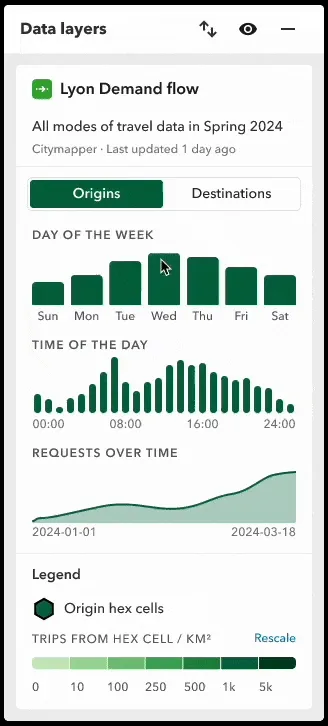
Through the disruption work, it became clear we weren’t fully conveying the value of Citymapper’s data. Demand modeling kept coming up: customers wanted a fast, lightweight way to understand how network changes would affect ridership — without commissioning a full four‑step model or relying on outdated household surveys.
With our new access to anonymized, real‑time origin–destination data from Citymapper, a few of data scientists, engineers, a product manager and I started an exploration into how ridership prediction could become an everyday planning tool rather than a rare, consultant‑driven exercise.
What is demand modeling?
Traditionally, travel demand modeling is a four‑step process:
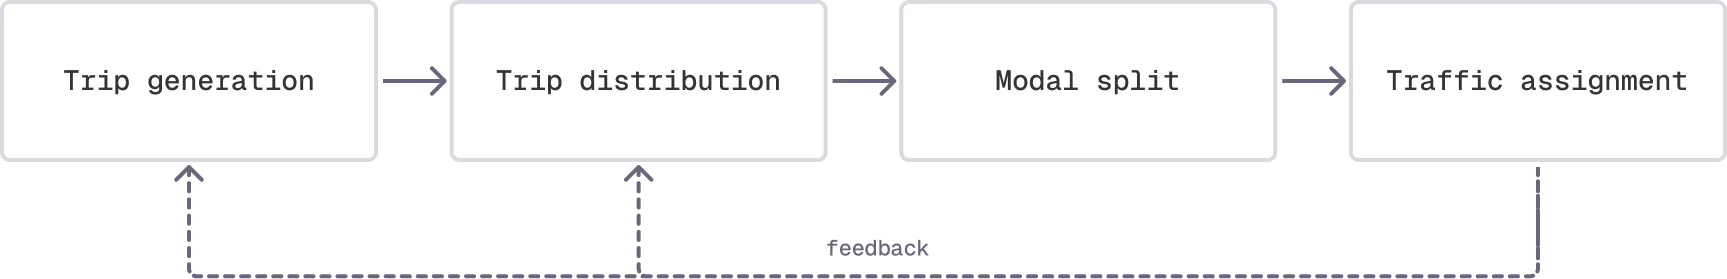
In my secdonary research and early conversations with planners, it was clear that the modeling tools planners have access to are typically labor‑ and time‑intensive, technically complex, and hard to interpret for non‑specialists. Worst of all, these models are usually created to simulate road traffic, so they are insensitve to public transit network changes. I ramped up quickly through a competitive scan and deep discussions with our data scientists, focusing on what model outputs would actually be actionable for planners in their day‑to‑day work.
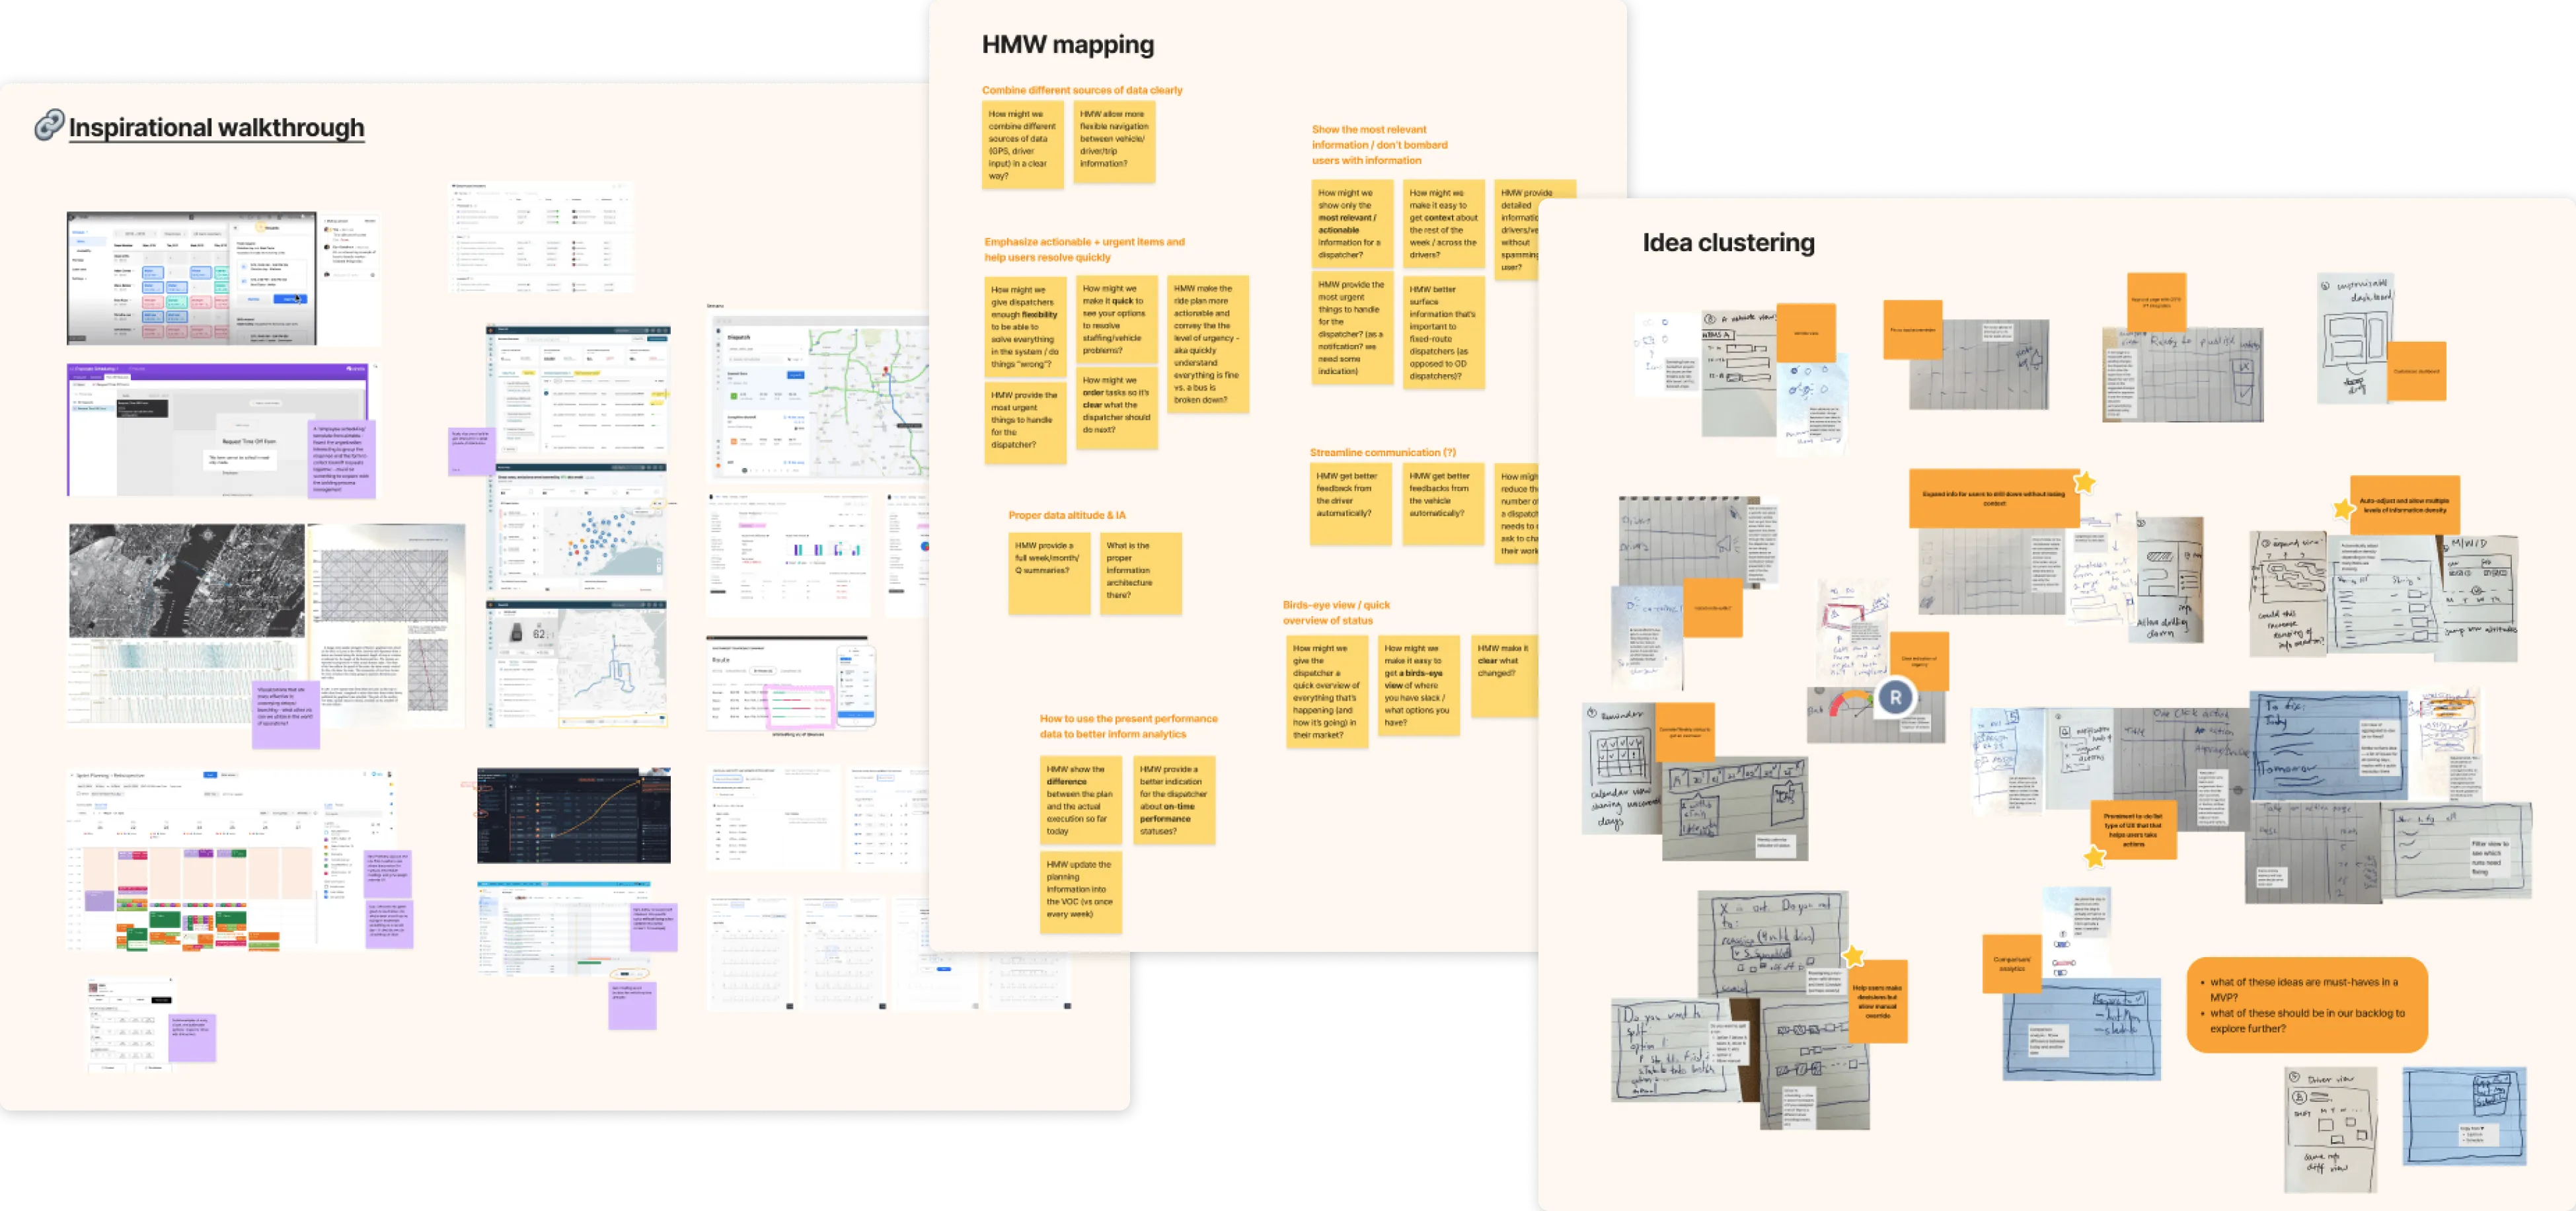
Design visioning
Instead of diving directly into scoping out the MVP, I created a set of vision mocks to facilitate alignment with the data science team and product team on the core capabilities of the MVP and help leadership understand the gaps of the remix product architecture in supporting deep analysis workflows like demand modeling.
We quickly distilled the minimum viable capabilities of a demand modeling product that feels like an extension of Remix rather than a separate tool:
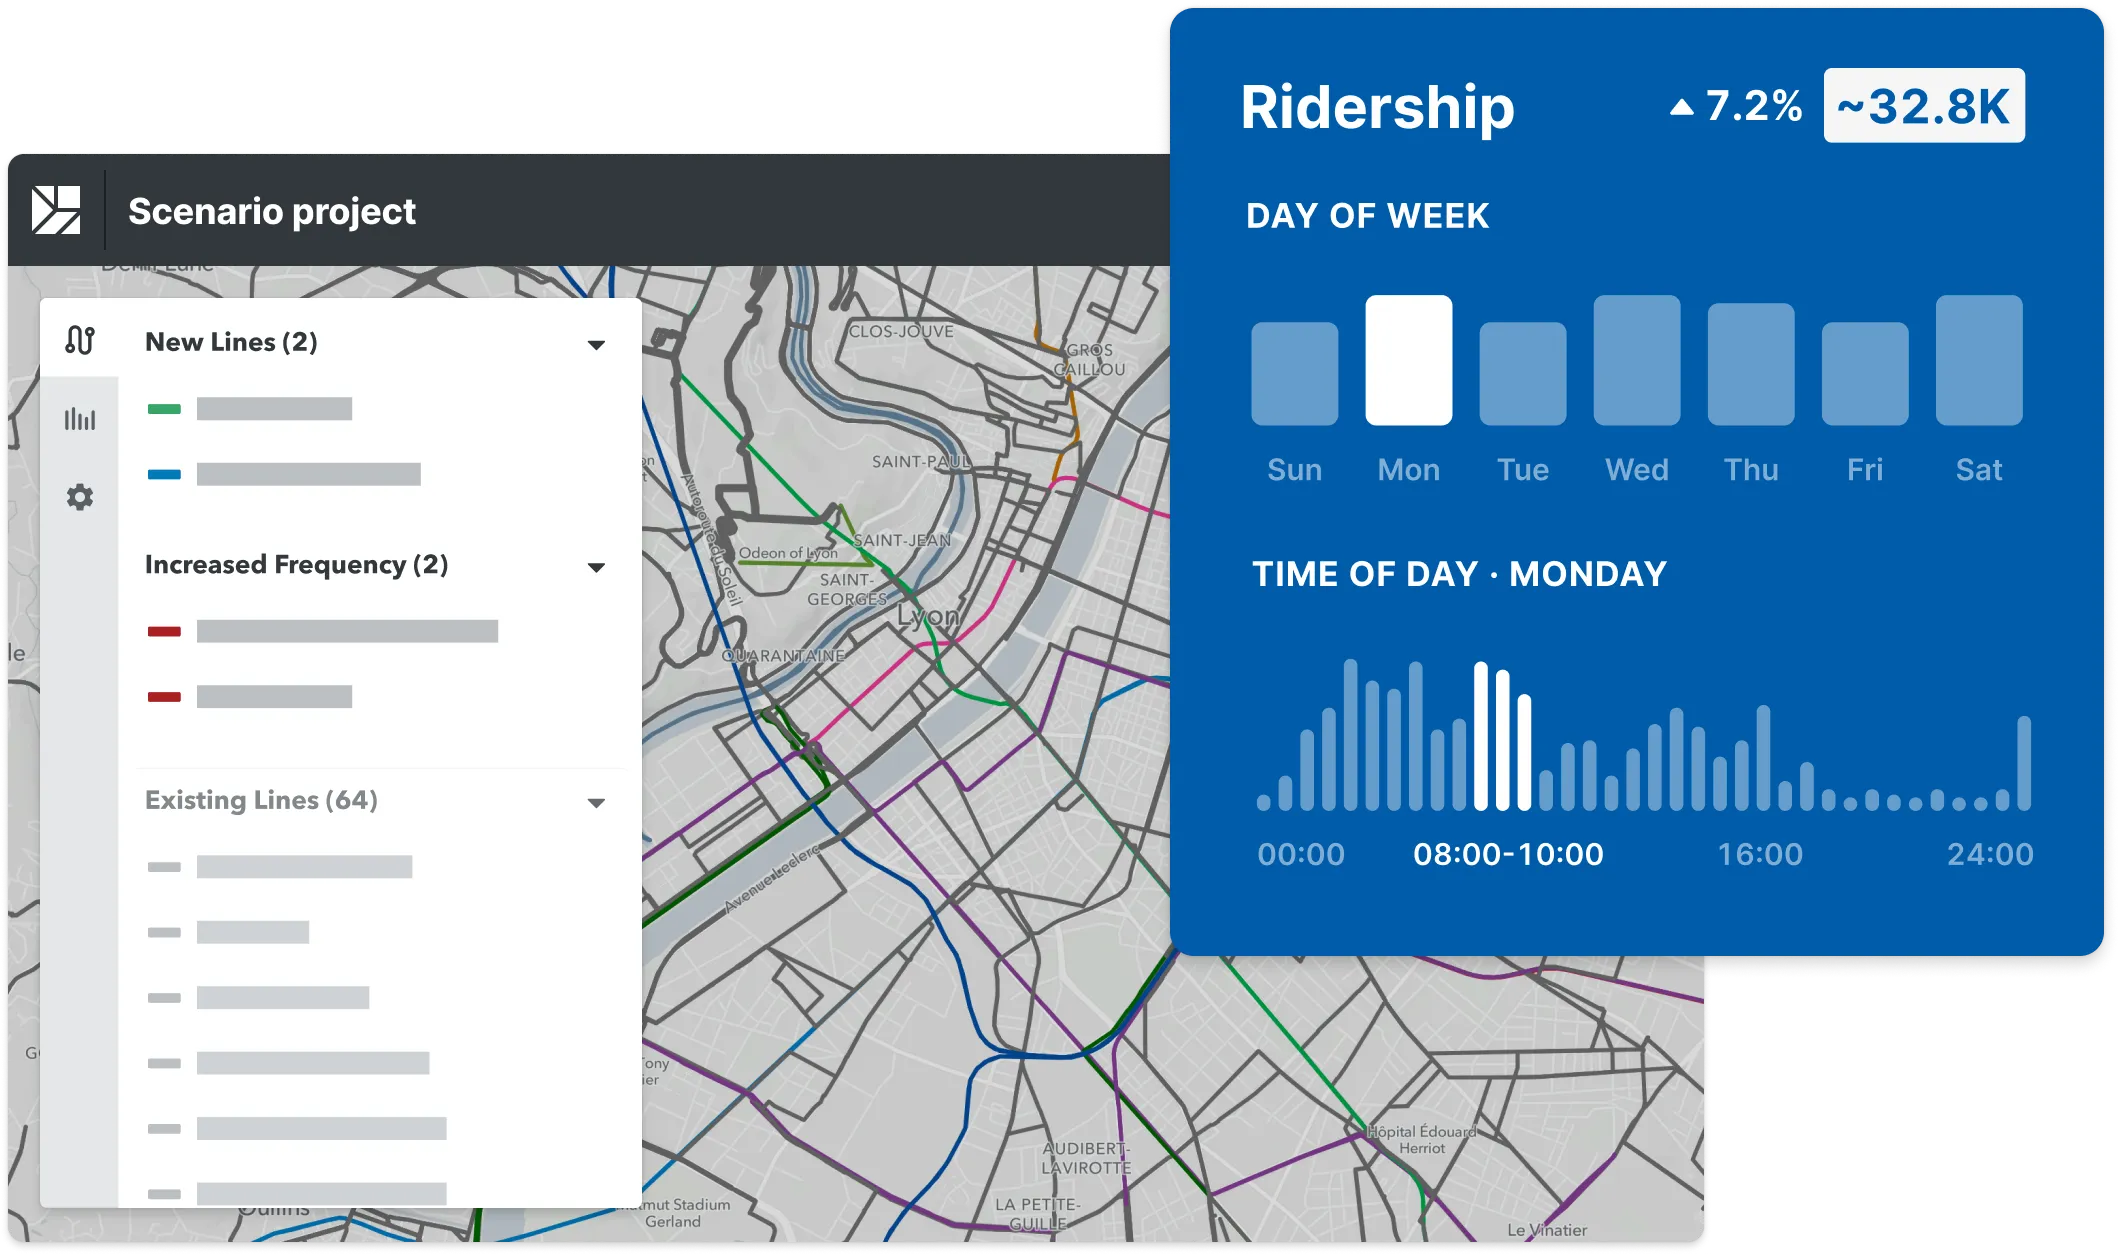
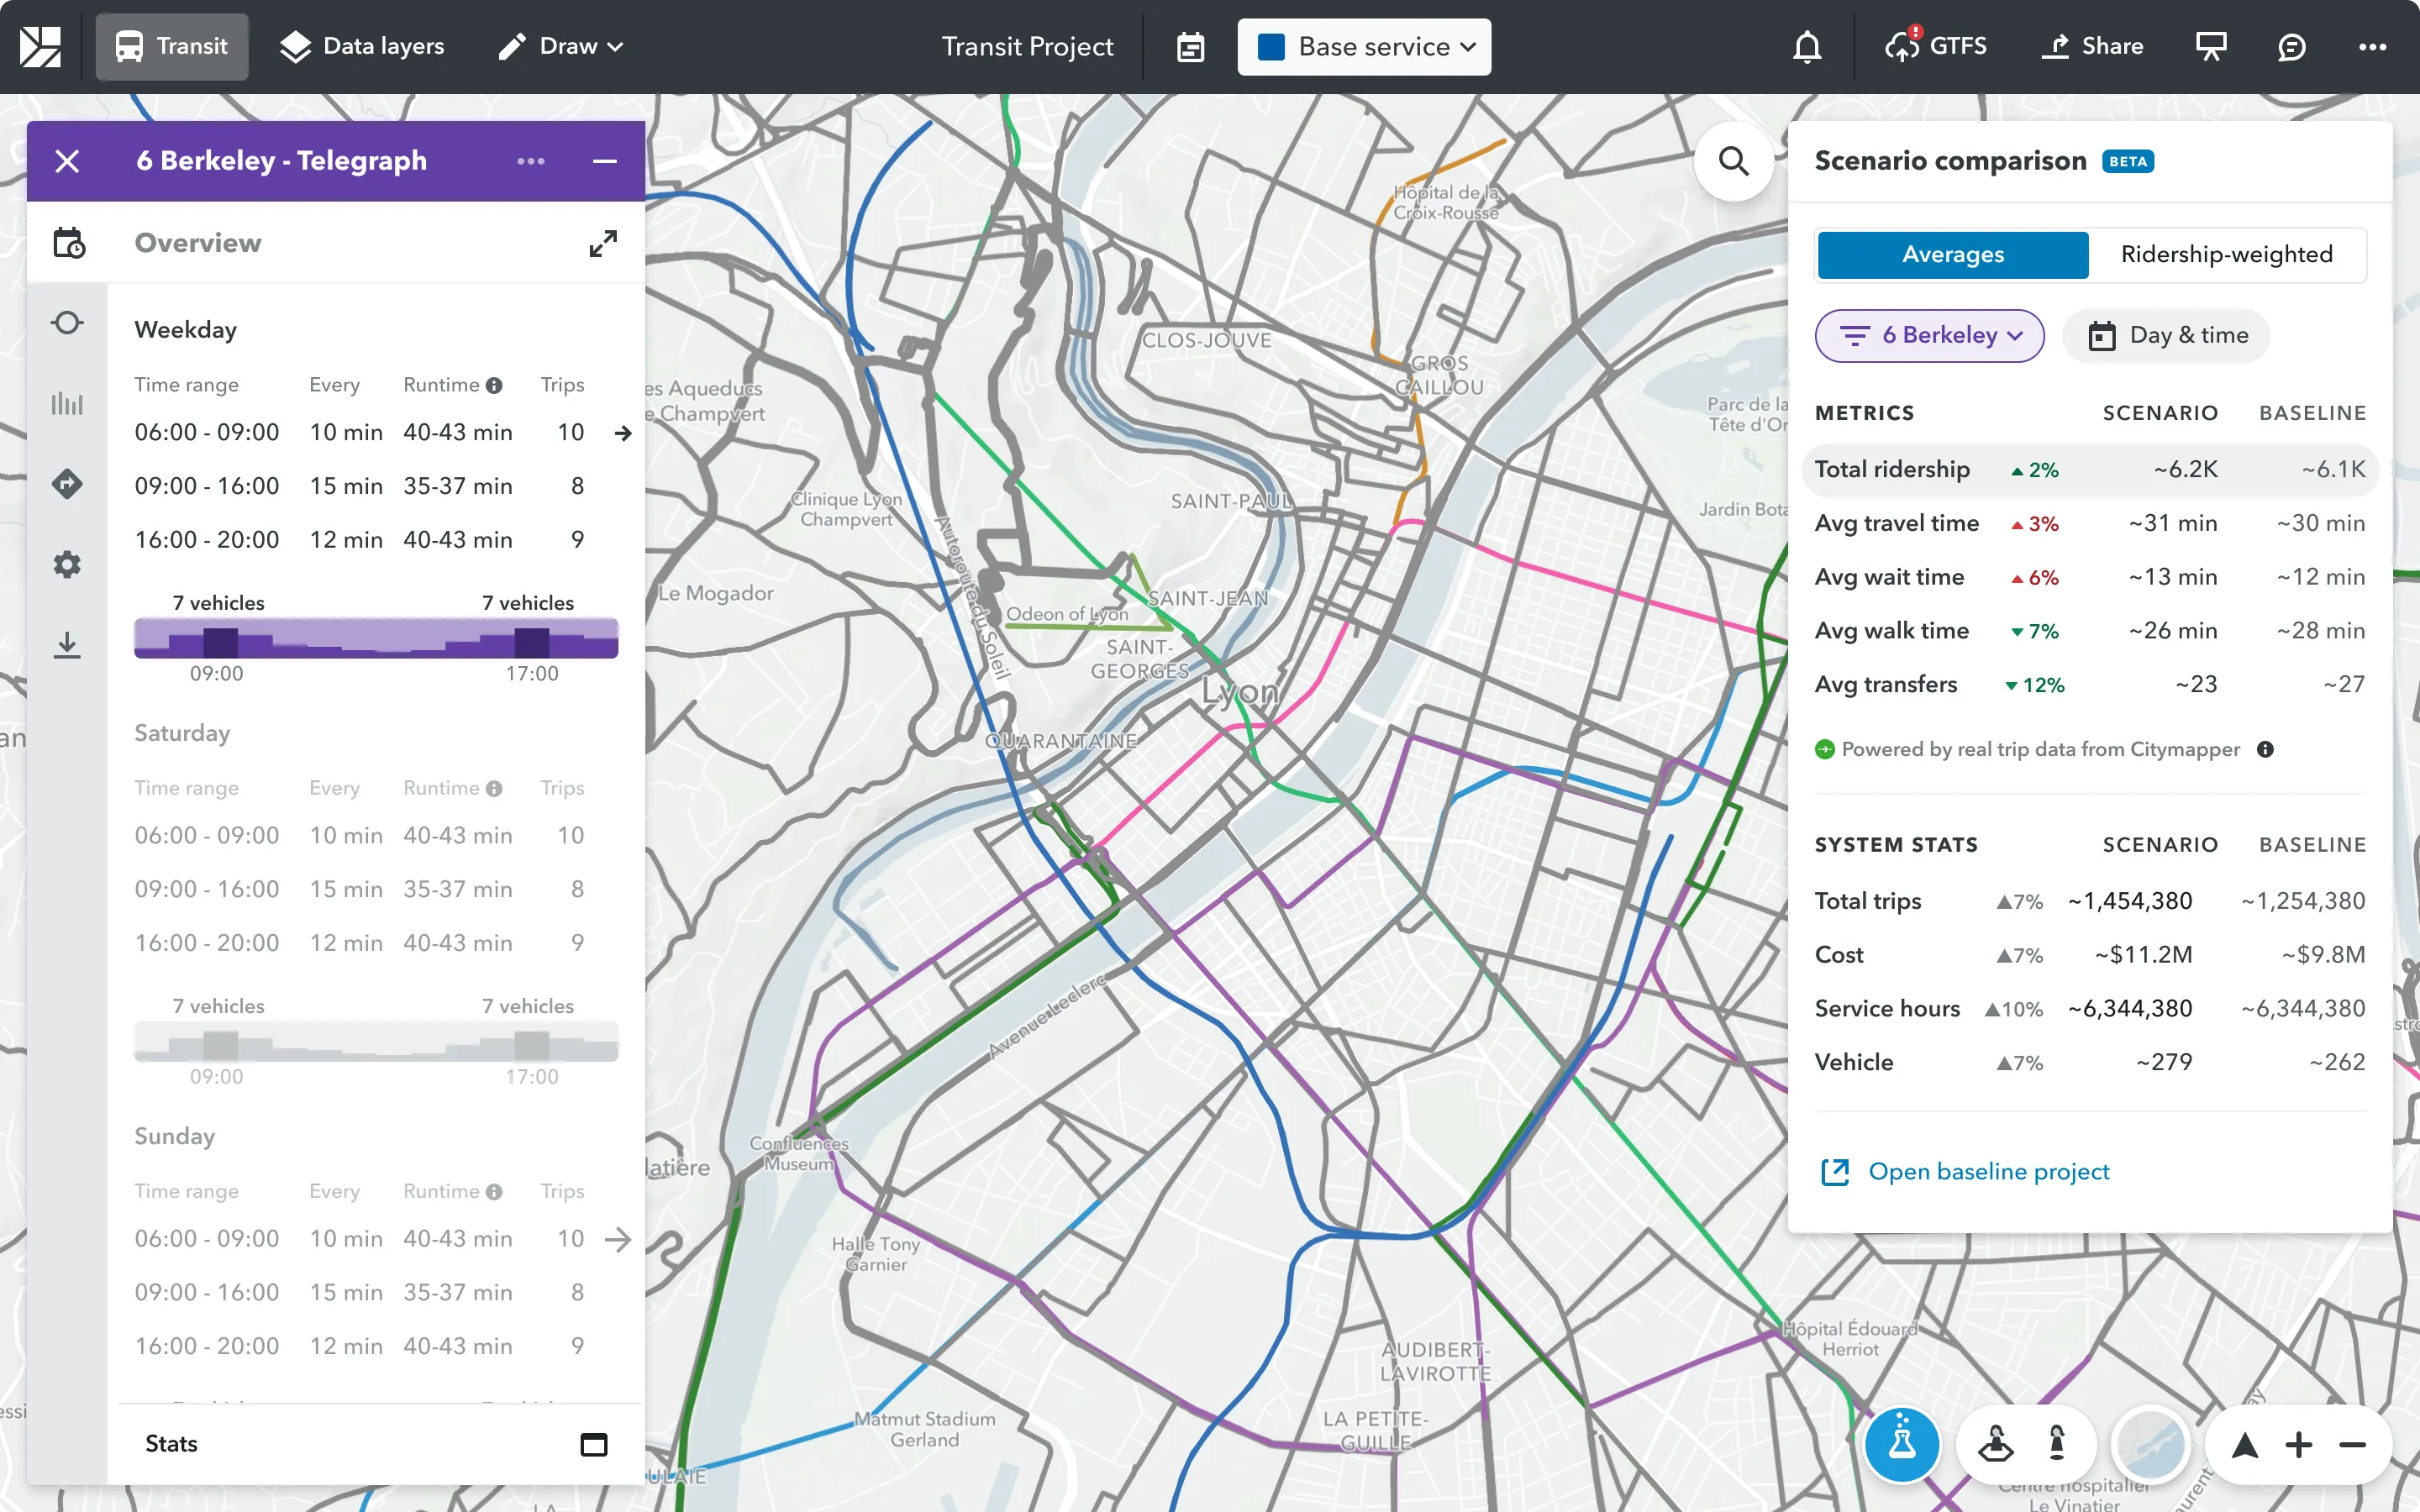
- Core capabilities: estimate ridership and key time metrics (walk, wait, in‑vehicle, total travel time) for proposed scenarios
- Core Advantager: let planners draw a change in Remix, click “Run analysis,” and start their analysis and explore trade‑offs — no manual data imports, GTFS validation, or model configuration.
Prototyping and user insight
We then built a working prototype so we could test with real customer data - this is especially important for data-intensive features like this, where a big part of the User Experience lies in the quality of the model output.
Main architecture: [add a image here]
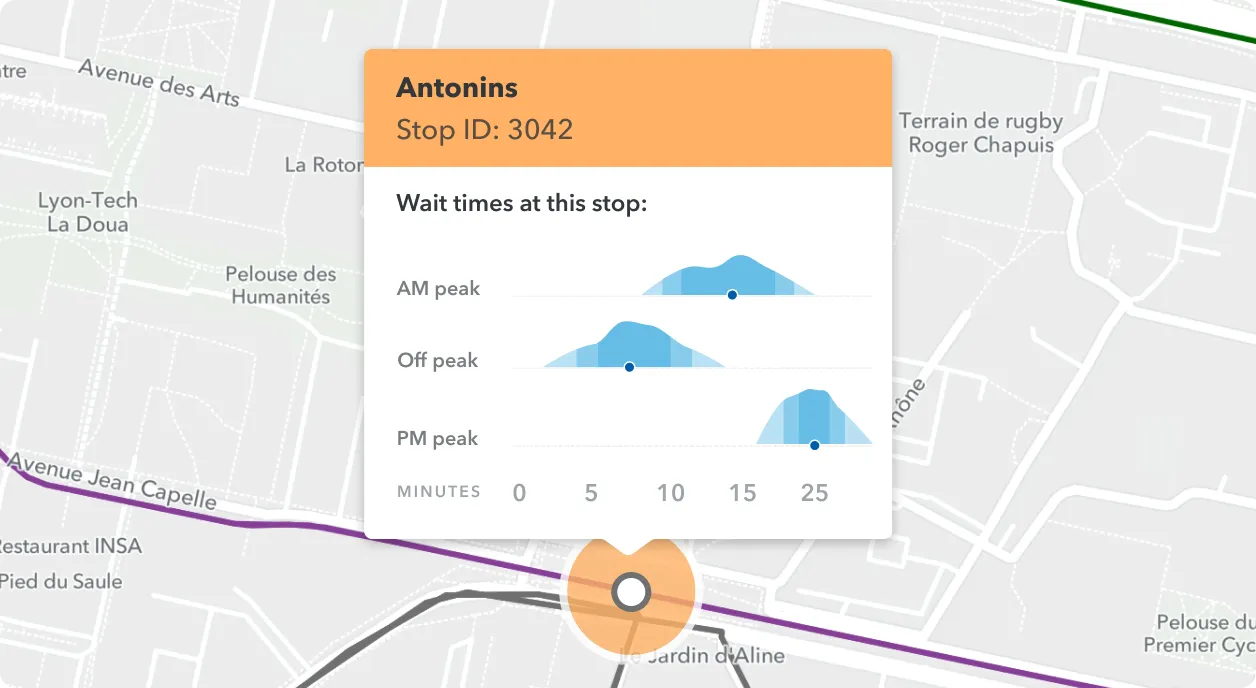
- Supporting different inquiries: Map + filter interactions: letting planners quickly filter by route, stop, geography, day of week, and time of day to answer questions like “What happens to access to this new job center during weekday peaks?”
- Interaction details: Using charts in the sidebar both as a summary of key metrics and as an entry point to navigate to specific problem areas, rather than burying everything in map layers.
- Communicating uncertainty: I explored ways to make uncertainty more transparent and actionable for planners.
Across pilots, we heard a consistent pattern: ridership modeling is crucial for evaluating service changes and making the case to stakeholders. Agencies could run scenario analyses in an hour or two inside Remix instead of waiting weeks for external studies, and see not just how many riders they might gain or lose, but how rider experience shifts across walk, wait, and travel times.
However, it also surfaced critical challenges such as data quality and coverage, especially as we scale beyond the United States. The team switched focus to work on data fusion (combining multiple data sources), especially the integration of agency ridership data.
Rolling off
Since I’ve rolled off the project early 2025, the team has continued to work on these priorities identified in the research to improve the underlying model, and also have welcomed our first paying transit agency customer!
Fixed Route Operations (2023)
Since Via acquired Remix, there has been a push to add operations into the product suite to truly achieve an “end‑to‑end fixed route” vision where agencies can plan, schedule, and operate their service on a single platform. The Ops team was formed without a designer, and when I joined the project, the team was feeling frustrated after an in‑depth tech investigation that concluded we could not build this feature in the Via platform. I was brought on board after the decision to build it in Remix so we could iterate faster and offer a more consistent UX.
I first got to know the team and led the first design‑vision workshop to reframe the problem space and product goals from a more user‑centric perspective. This greatly boosted team morale!
I then synthesized a large amount of complex context to create the product vision — aside from daily operations, this also included a driver‑bidding portal, live tracking of vehicles, and accident resolution. This work generated excitement, unblocked the tech investigation and planning, and formed the basis of a roadmap that we could further validate with customers.
Now this product lives with in Remix Scheduling and looks rather different from the first version I helped create, but it’s still been fulfilling to watch agencies shift their process from Pen and Paper to a digital workflow. Today, this product provides the stickiest workflows in the suite — staff use it every day to assign vehicles to trips and monitor service.